A subscription to JoVE is required to view this content. Sign in or start your free trial.
Method Article
Identification and Analysis of Mouse Erythroid Progenitors using the CD71/TER119 Flow-cytometric Assay
In This Article
Summary
A flow-cytometric method for identification and molecular analysis of differentiation-stage-specific murine erythroid progenitors and precursors, directly in freshly –harvested mouse bone marrow, spleen or fetal liver. The assay relies on cell-surface markers CD71, Ter119, and cell size.
Abstract
The study of erythropoiesis aims to understand how red cells are formed from earlier hematopoietic and erythroid progenitors. Specifically, the rate of red cell formation is regulated by the hormone erythropoietin (Epo), whose synthesis is triggered by tissue hypoxia. A threat to adequate tissue oxygenation results in a rapid increase in Epo, driving an increase in erythropoietic rate, a process known as the erythropoietic stress response. The resulting increase in the number of circulating red cells improves tissue oxygen delivery. An efficient erythropoietic stress response is therefore critical to the survival and recovery from physiological and pathological conditions such as high altitude, anemia, hemorrhage, chemotherapy or stem cell transplantation.
The mouse is a key model for the study of erythropoiesis and its stress response. Mouse definitive (adult-type) erythropoiesis takes place in the fetal liver between embryonic days 12.5 and 15.5, in the neonatal spleen, and in adult spleen and bone marrow. Classical methods of identifying erythroid progenitors in tissue rely on the ability of these cells to give rise to red cell colonies when plated in Epo-containing semi-solid media. Their erythroid precursor progeny are identified based on morphological criteria. Neither of these classical methods allow access to large numbers of differentiation-stage-specific erythroid cells for molecular study. Here we present a flow-cytometric method of identifying and studying differentiation-stage-specific erythroid progenitors and precursors, directly in the context of freshly isolated mouse tissue. The assay relies on the cell-surface markers CD71, Ter119, and on the flow-cytometric 'forward-scatter' parameter, which is a function of cell size. The CD71/Ter119 assay can be used to study erythroid progenitors during their response to erythropoietic stress in vivo, for example, in anemic mice or mice housed in low oxygen conditions. It may also be used to study erythroid progenitors directly in the tissues of genetically modified adult mice or embryos, in order to assess the specific role of the modified molecular pathway in erythropoiesis.
Protocol
1. Harvesting of tissues
- Prepare tubes containing 2 to 5 ml cold staining buffer (phosphate-buffered saline (PBS) with added 0.2% BSA and 5mM glucose). Keep tubes on ice prior to tissue harvest.
- Cull mice according to appropriate approved protocol (e.g. CO2 inhalation followed by cervical dislocation).
- Draw blood by cardiac puncture into EDTA or heparin blood-collection tubes for later analysis, e.g. of hematocrit, reticulocyte count or CBC analysis.
- Harvest the spleen and bones, placing tissues from each mouse in a separate tube, prepared in step 1. Easy access to spleen is from the left side. For the bone-marrow, harvest one or both femurs. Keep harvested tissue on ice.
- If desired, weigh the spleen. Mice undergoing an erythropoietic stress response are likely to show a significant increase in spleen weight.
2. Preparation of spleen cells
- Using a pre-moistened 3 ml syringe plunger, gently push the spleen, or part of the spleen (ideally, 0.1 gram or less, equivalent to approximately 108 cells) through a 40 μm sterile cell strainer (Fisherbrand catalog number 22363547 or other) placed on top of a 50 ml conical tube. Keep the tube on ice during this procedure. Wash the cells through the strainer with a total of 2 ml staining buffer.
- Gently pipette the strained cell suspension to break up any small clumps. If necessary, re- strain the cells.
- Wash the cells twice by centrifugation and re-suspend in cold buffer.
- Count the cells using a hemocytometer. Typical yields are 1-2 x 10⁸ cells/spleen. For flow-cytometry analysis, aliquote 1 to 2 million cells per sample, either into FACS staining tubes (BD Falcon polystyrene round-bottom tubes, 352008) or U-bottom 96 well plate (BD Falcon 353910). Sample staining volume is 200 μl, to a final cell concentration 0.5 to 1 x 10⁷ cells/ ml or 1-2 x 10⁶ cells/ 200 μl sample.
3. Preparation of bone-marrow cells
- Prepare 1 or 3 ml syringes with an attached 26G needle, pre-filled with cold staining buffer.
- Remove muscles attached to the femur so as to visualize the bone clearly.
- Using sharp surgical scissors, snip off both ends of the femur, as close as possible to the ends of the bone. This should reveal a small hole at each cut end, leading into the bone marrow cavity, which runs through the length of the femur.
- Using the pre-filled syringes in step 1, insert the needle through one of these holes, and gently flush the marrow out through the hole at the other end, into a tube.
- Dissociate the flushed cells by gentle pipetting, and strain through a 40 μm strainer as for the spleen above (see section 2.1).
- Wash cells twice by centrifugation in cold staining buffer
- Count the cells and resuspend as in section 2.4. Typical yields are approximately 107 cells per femur.
4. Preparation of fetal liver cells
- To prepare timed-pregnant female mice, set up mice for mating in the evening; examine for vaginal plugs before 10 am the following day; the day on which the vaginal plug is detected is considered day 0.5. Veterinary staff may be able to assist investigators who are unfamiliar with this technique to identify pregnant females. Pregnancy can also be determined by monitoring mouse weight.
- Timed –pregnant female mice are culled on days 12.5 to 14.5 of pregnancy. The uterine horns are removed into a Petri-dish containing ice-cold culture medium or staining buffer.
- Embryos are removed from each uterus and the fetal liver is dissected. A dissecting microscope is required for embryonic day 12.5 (E12.5) or younger.
- Livers may be dissociated mechanically by pipetting in buffer, and are processed either individually in 96 well plates, or pooled together, depending on experimental requirements.
- A fetal liver at E13.5 has ~107 cells. Cells are washed twice in staining buffer and resuspended at 1-2 x 10⁶ cells/ 200 μl sample for flow cytometric analysis.
5. Antibody staining for flow cytometry
- Prepare a primary antibody staining pre-mix to be used for all samples, except for control samples, containing the following:
- ChromePure Rabbit IgG (Jackson, 015-000-003), to a final concentration of 200μg/ml. Check the stock concentration on the bottle (it can vary). This is used to block Fc receptors in mouse cells; alternative species that may be used for this are mouse IgG or rat IgG. Species choice is determined by the potential presence in the staining protocol of secondary antibodies directed against primary rat/mouse/rabbit antibodies, in which case those species cannot be used as blocking antibodies. Alternatively, 5% rabbit serum may also be used in place of purified IgG. A further alternative is the use of monoclonal antibodies or Fab fragments directed at the mouse Fc receptors. The basic protocol below does not include any secondary antibodies and so IgG of any of the three species may be used.
- CD71-FITC, diluted 1:200 (stock 0.5mg/ml, BD-Biosciences, 553266)
- Ter119-PE, diluted 1:200 (stock 0.2mg/ml, BD-Biosciences, 553673)
- Any additional antibodies directed at surface epitopes of interest, e.g. antibodies directed at Fas or FasL (see 1,2). Mix the antibody solution gently by inverting the tube 2-3 times.
- Add 200 μl of the pre-mix to each cell sample and gently re-suspend the cells.
- Prepare control cell samples as follows:
- 'Unstained': these cells are left in staining buffer and provide the background autofluorescence of the cells.
- 'Single color' controls: one such control is required for each antibody/color used in the protocol. The cells in these controls are stained either with a directly conjugated primary antibody, or with both a primary antibody and a conjugated secondary antibody. These controls are used to correct for spectral overlap between channels.
- 'Fluorescence minus one' (FMO) controls: one such control is required for each antibody/color in the protocol: cells are stained with all the colors/antibodies in the protocol except for the color/antibody for which this is the FMO control. The FMO control for a particular channel provides the true background for that channel. It may include non-specific antibody of the same isotype, and conjugated with the same fluorescence mark as the test antibody (isotype control).
- Incubate samples and relevant controls in the primary antibody stain on ice for 45' to 1 hour in the dark (put aluminium foil cover on ice-bucket).
- At the end of incubation, wash the cells by adding 3ml of staining buffer to each sample tube and spin for 3' to 5' at approximately 400 x g at 4°C. If using 96 well plates, wash the cells three times in a volume of 200 μl.
- If relevant, apply secondary antibody stain. Apply and wash as for the first antibody stain.
- If relevant, a stain with Annexin V is applied at the end of incubation, using a hepes buffer as in the manufacturer's instructions. This stain is applied for 15 minutes at room-temperature, or for 1 hour on ice.
- Cells are re-suspended for flow-cytometry analysis in staining solution containing a cell-impermeable DNA dye, to exclude dead cells. Several DNA dyes are available, including Propidium Iodide, 7-amino-actinomycin D (7AAD), or DAPI. The choice from amongst these depends on the available channels, given the channels taken up for specific antibody staining, and channels available on the flow-cytometer. 7AAD is obtained from BD-Biosciences (559925) and used according to the manufacturer's instructions. For DAPI staining, make a stock of 1mg/ml in dimethylformamide (DMF) from powder (Roche, Cat # 236276), keep at -20°C, and dilute 1:10,000 to 1:15,000 in staining buffer.
6. Flow-cytometric sorting
- Cells are labeled with antibodies against CD71, Ter119, lineage markers, and a viability dye as described for flow-cytometric analysis (section 5). Cell concentration during labeling may be increased to 5 x 10⁷/ml.
- Mix an equal volume of each of the following antibodies to make the lineage master mix:
- FITC Rat Anti-Mouse CD41 MWReg30, BD Pharmingen 553848
- FITC Rat Anti-Mouse CD45R/B220 RA3-6B2, BD Pharmingen 553087
- FITC Hamster Anti-Mouse CD3e 145-2C11, BD Pharmingen 553061
- FITC Rat Anti-Mouse CD11b/Mac-1 M1/70, BD Pharmingen 557396
- FITC Rat Anti-Mouse Ly-6G and Ly-6C (Gr-1) RB6-8C5, BD Pharmingen 553126
- Use the master mix at 1:80 (This is equivalent to 1:400 dilution of each individual antibody stocks, which are all 0.5 mg/ml).
- Use low-pressure sorting conditions and wide nozzles. For the Aria (BD Biosciences) we use 100 μ nozzle, 20 psi pressure.
- Collection buffer: PBS with added 20% Fetal Bovine Serum.
- To check the purities of the sorted populations, re-run a small aliquot from each sample in a buffer that contains a viability dye (7AAD or similar).
7. Representative Results:
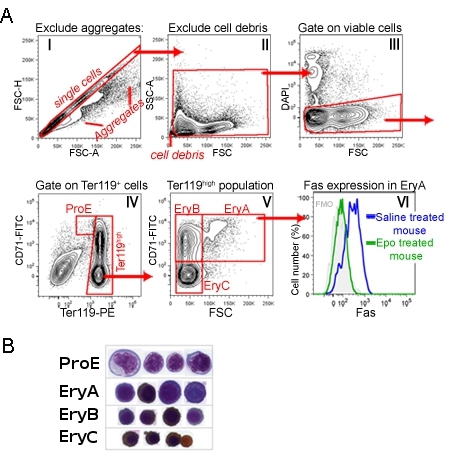
CD71/Ter119 staining of adult bone-marrow or spleen identifies a developmental sequence of four subsets, labeled ProE, EryA, EryB and EryC (Figure 1) 1. Morphologically, these correspond to increasingly mature erythroblasts. Figure 1 illustrates the gating sequence at the data analysis stage, which discards very small event (including nuclei, red cells), aggregated cells and dead cells.
Expression of cell-surface proteins may be measured simultaneously for each of these subsets, by adding the relevant antibodies at the same time as Ter119 and CD71 staining. Figure 1 shows an example of cell-surface expression of the death receptor Fas 1. This measurement was carried out in mice injected with Epo, or in control mice injected with saline. It is apparent that Epo suppresses Fas expression in the EryA population in vivo 1.
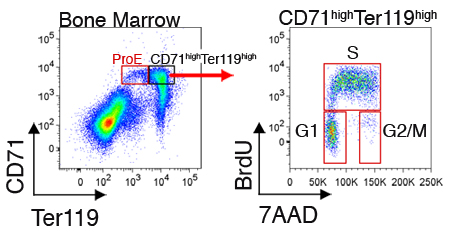
Expression of intracellular proteins or cell cycle status may also be measured for cells in each subset. Figure 2 illustrates representative cell cycle analysis of freshly harvested bone marrow cells. These measurements require, in addition to cell surface staining with CD71 and Ter119, the fixation and permeabilization of cells for intracellular labeling (see Discussion section).
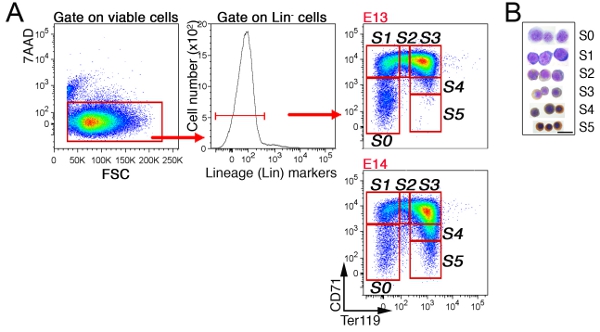
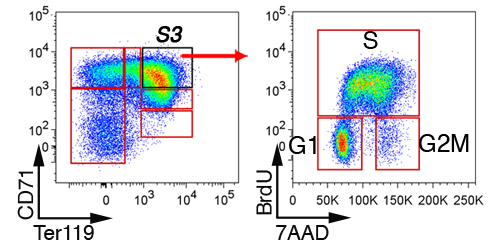
In fetal liver, non-erythroid cells are first excluded by gating on 'Lin-' cells that are negative for CD41, Mac-1, Gr-1, B220 and CD3 (Figure 3). The remaining cells are sub-divided into 6 subsets, S0 to S5. The precise pattern of cells in fetal liver is dependent on embryonic age (see Discussion section). A representative cell cycle analysis of the S3 subset in E13.5 fetal liver is shown (Figure 4).

Figure 1. The CD71/Ter119 erythroid subsets in mouse spleen. A. Gating strategy: Spleen cells were processed and labeled with antibodies directed at CD71, Ter119 and Fas. This figure shows the analysis strategy following the data acquisition step. Histogram I shows all acquired events. The diagonal gate represents events that are likely to be single cells, excluding doublets or larger aggregates. Cells in this gate are further analyzed in histogram II. Here very small events, likely nuclei or debris, are excluded. The gated cells are shown in histogram III, where DAPI-positive cells, that are likely membrane-permeable apoptotic cells, are excluded from further analysis. Histogram IV shows the resulting population of viable spleen cells. The ProE gate contains CD71highTer119intermediate cells. Ter119high cells are further analyzed in histogram V. Here CD71high cells are subdivided into less mature, large 'EryA' erythroblasts (CD71highTer119highFSChigh) and smaller, more mature 'EryB' erythroblasts (CD71highTer119highFSClow). The most mature erythroblast subset is EryC (CD71lowTer119highFSClow). Histogram VI shows cell-surface Fas expression, specifically in the EryA subset, in mice in the basal state (injected with saline), and mice injected with a single dose of Epo. Staining with Fas antibody was carried out simultaneously with the CD71/Ter119 staining. B. Cytospin preparations of cells sorted from each of the indicated subsets. Cells were stained with Giemsa and with Diaminobenzidine, the latter generates a brown stain with hemoglobin. Cytospin data was originally published in Liu et al., Blood. 2006 Jul 1;108(1):123-33. Epub 2006 Mar 9.

Figure 2. Cell cycle analysis of CD71highTer119high erythroblasts in mouse bone marrow. Mice were injected intraperitoneally with BrdU, and spleen or bone-marrow were harvested 30 to 60 minutes later. Cells were fixed and permeabilized and in addition to being stained for CD71 and Ter119, were stained for BrdU incorporation into their replicating DNA with a monoclonal antibody directed at BrdU (fixation, permeabilization and BrdU-staining protocol was according to manufacturer's instruction). BrdU-positive cells are in S-phase of the cycle. Interphase cells are BrdU-negative and may be resolved into G1 or G2/M phases, using the DNA dye 7AAD.

Figure 3. CD71/Ter119 erythroid subsets in mouse fetal liver. A. Gating strategy: Fetal liver cells were labeled for CD71, Ter119, and a cocktail of FITC –labeled antibodies directed at non-erythroid lineage markers ('Lin'). Viable cells (7AAD-negative) were analyzed for Lin expression, and the Lin- cells are further subdivided into the S0 to S5 erythroid subsets. Younger, E13 fetal liver is composed of less mature erythroblasts, shown by the absence of cells in the mature S4/S5 subsets. B. Cytospin preparations of cells sorted from each of the indicated subsets. Cells were stained with Giemsa and with Diaminobenzidine, the latter generates a brown stain with hemoglobin. Cytospin data was originally published in Pop et al., PLoS Biol 8(9): e1000484. doi:10.1371/journal.pbio.1000484 .

Figure 4. Cell cycle analysis of fetal liver erythroid subsets. Pregnant mice were injected with BrdU, and fetal livers were harvested 30 to 60 minutes later, fixed, permeabilized, and stained with antibodies against CD71, Ter119 and BrdU. Cell cycle status of S3 cells is shown.
Discussion
The flow-cytometric methodology allows simultaneous investigation of any cellular function that may be detected with a fluorescence-conjugated specific antibody or ligand, including cell surface markers, protein expression, cell survival, cell signaling using phospho-specific antibodies 3 and cell cycle status. These measurements may be made in each of a number of differentiation-stage specific subsets, in the context of freshly isolated erythropoietic tissue. This method therefore allows assessment of functio...
Disclosures
Experiments on animals were performed in accordance with the guidelines and regulations set forth by University of Massachusetts Medical School IACUC committee.
Acknowledgements
We thank the UMass flow cytometry core: Richard Konz, Ted Giehl, Barbara Gosselin, Yuehua Gu and Tammy Krupoch. This work was funded by NIH/NHLBI RO1 HL084168 (M.S.) and NIH CA T32-130807 (J.R.S.). Core resources supported by the Diabetes Endocrinology Research Center grant DK32520 were also used.
Materials
| Name | Company | Catalog Number | Comments |
| Fas-biotin | BD Biosciences | 554256 | |
| Streptavidin-APC | Molecular Probes, Life Technologies | S868 | |
| 40 μm sterile cell strainer | Fisher Scientific | 22363547 | |
| Polystyrene round-bottom tubes for FACS staining | BD Biosciences | 352008 | |
| U-bottom 96 well plate | BD Biosciences | 353910 | |
| ChromePure Rabbit IgG | Jackson ImmunoResearch | 015-000-003 | |
| CD71-FITC (stock 0.5mg/ml) | BD Biosciences | 553266 | |
| Ter119-PE (stock 0.2mg/ml) | BD Biosciences | 553673 | |
| 7AAD | BD Biosciences | 559925 | |
| DAPI powder | Roche Group | 236276 | |
| FITC Rat Anti-Mouse CD41 MWReg30 | BD Biosciences | 553848 | |
| FITC Rat Anti-Mouse CD45R/B220 RA3-6B2 | BD Biosciences | 553087 | |
| FITC Rat Anti-Mouse CD411b/Mac-1 M1/70 | BD Biosciences | 557396 | |
| FITC Rat Anti-Mouse Ly-6G and Ly-6C (Gr-1) RB6-8C5 | BD Biosciences | 553126 | |
| FITC Hamster Anti-Mouse CD3e 145-2C11 | BD Biosciences | 553061 | |
| APC BrdU Flow kit | BD Biosciences | 557892 | |
| Annexin V-biotin | BD Biosciences | 556418 |
References
- Liu, Y. Suppression of Fas-FasL coexpression by erythropoietin mediates erythroblast expansion during the erythropoietic stress response in. 108, 123-133 (2006).
- Socolovsky, M. Negative Autoregulation by FAS Mediates Robust Fetal Erythropoiesis. PLoS Biol. 5, e252-e252 (2007).
- Krutzik, P. O., Hale, M. B., Nolan, G. P. Characterization of the murine immunological signaling network with phosphospecific flow cytometry. J Immunol. 175, 2366-2373 (2005).
- Socolovsky, M. Ineffective erythropoiesis in Stat5a(-/-)5b(-/-) mice due to decreased survival of early erythroblasts. Blood. 98, 3261-3273 (2001).
- Guihard, S. The MAPK ERK1 is a negative regulator of the adult steady-state splenic erythropoiesis. Blood. 115, 3686-3694 (2010).
- Yu, X. An erythroid chaperone that facilitates folding of alpha-globin subunits for hemoglobin synthesis. J Clin Invest. 117, 1856-1865 (2007).
- Chen, M. L. Erythroid dysplasia, megaloblastic anemia, and impaired lymphopoiesis arising from mitochondrial dysfunction. Blood. 114, 4045-4053 (2009).
- Chen, K. Resolving the distinct stages in erythroid differentiation based on dynamic changes in membrane protein expression during erythropoiesis. Proc Natl Acad Sci U S A. 106, 17413-17418 (2009).
- McGrath, K. E., Bushnell, T. P., Palis, J. Multispectral imaging of hematopoietic cells: where flow meets morphology. J Immunol Methods. 336, 91-97 (2008).
- Pop, R. A key commitment step in erythropoiesis is synchronized with the cell cycle clock through mutual inhibition between PU.1 and S-phase progression. PLoS Biol. 8, (2010).
- Borsook, H., Lingrel, J. B., Scaro, J. L., Millette, R. L. Synthesis of haemoglobin in relation to the maturation of erythroid cells. Nature. 196, 347-350 (1962).
Reprints and Permissions
Request permission to reuse the text or figures of this JoVE article
Request PermissionExplore More Articles
This article has been published
Video Coming Soon
Copyright © 2025 MyJoVE Corporation. All rights reserved