
A subscription to JoVE is required to view this content. Sign in or start your free trial.
Method Article
Simultaneous Measurement of HDAC1 and HDAC6 Activity in HeLa Cells Using UHPLC-MS
* These authors contributed equally
In This Article
Summary
The present method serves to identify isoform-specific inhibitors of histone deacetylases (HDAC) in HeLa cells by the UHPLC-MS analysis of multiple substrates. This is an antibody-free method developed to reflect HDAC1 and HDAC6 activity in the living cell environment, in contrast to single-isoform cell-free assays.
Abstract
The search for new histone deacetylase (HDAC) inhibitors is of increasing interest in drug discovery. Isoform selectivity has been in the spotlight since the approval of romidepsin, a class I HDAC inhibitor for cancer therapy, and the clinical investigation of HDAC6-specific inhibitors for multiple myeloma. The present method is used to determine the inhibitory activity of test compounds on HDAC1 and HDAC6 in cells. The isoform activity is measured using the ultra-high-performance liquid chromatography – mass spectrometry (UHPLC-MS) analysis of specific substrates incubated with treated and untreated HeLa cells. The method has the advantage of reflecting the endogenous HDAC activity within the cell environment, in contrast to cell-free biochemical assays conducted on isolated isoforms. Moreover, because it is based on the quantification of synthetic substrates, the method does not require the antibody recognition of endogenous acetylated proteins. It is easily adaptable to several cell lines and an automated process. The method has already proved useful in finding HDAC6-selective compounds in neuroblasts. Representative results are shown here with the standard HDAC inhibitors trichostatin A (non-specific), MS275 (HDAC1-specific), and tubastatin A (HDAC6-specific) using HeLa cells.
Introduction
HDACs belong to a family of enzymes able to deacetylate histones within the chromatin structure. They also have other protein substrates in the cytosol and are located in various cell compartments. A total of 18 HDAC isoforms have been identified so far and have been related to several cell mechanisms, including the regulation of transcription factors and gene expression, as well as cell signaling and transport1,2,3,4,5,6,7. HDAC catalytic inhibitors have emerged as potential therapeutic drugs for cancer therapy. Most HDAC inhibitors currently approved by the FDA are for the treatment of T-cell lymphoma and multiple myeloma, and are non-specific HDAC inhibitors, such as vorinostat (SAHA), belinostat, and panobinostat8,9. However, a series of side effects have been associated with pan-inhibitors, and the search for isoform-specific small molecules is a hot topic in medicinal chemistry and drug discovery. Accordingly, the class I (HDAC1-3 and HDAC8) selective inhibitor romidepsin is an already approved drug10, while HDAC6-specific inhibitors are currently under clinical trials, with increased therapeutic potential in multiple myeloma11,12,13,14,15.
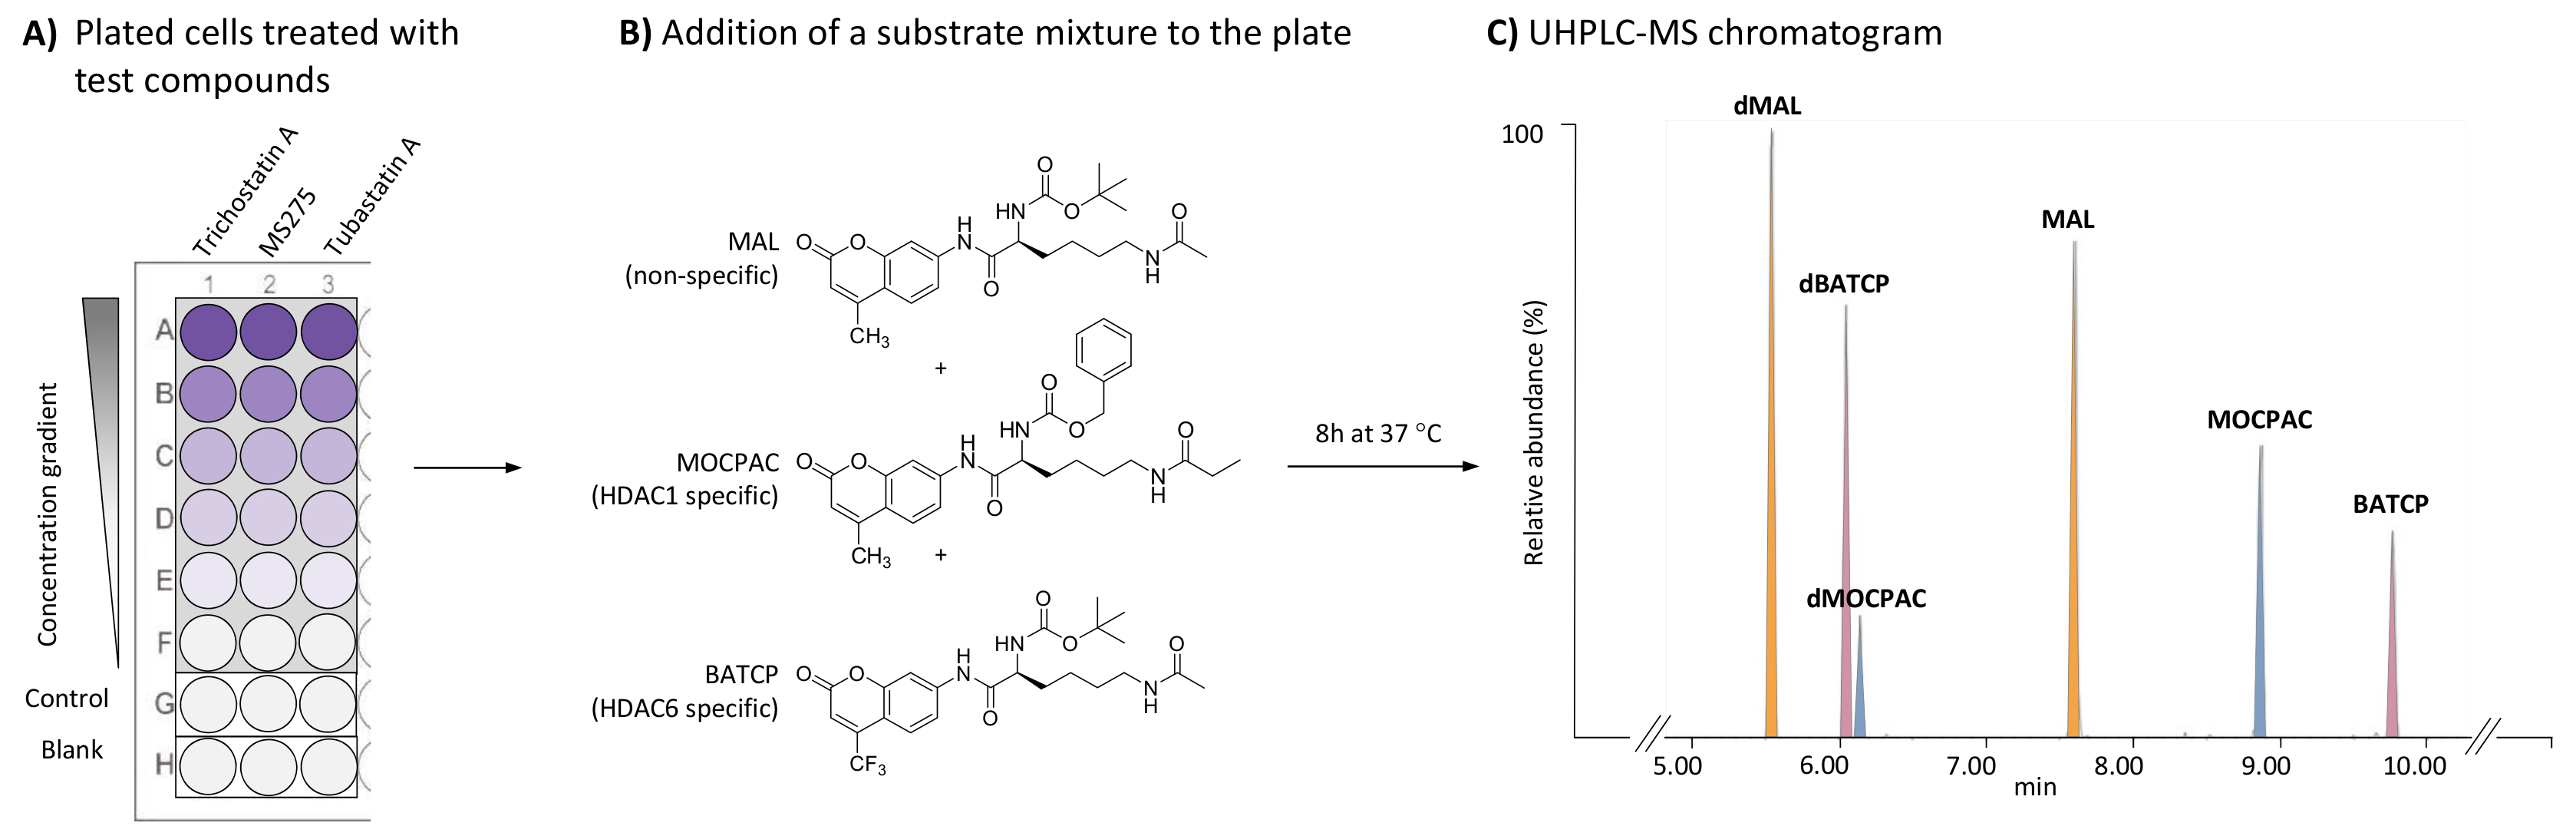
Screening assays to characterize HDAC inhibitors are based on the incubation of an HDAC substrate with an enzymatic source (single isoform, nuclear extract, or cell lysate). The substrate is usually a small peptide sequence containing an acetyl lysine residue coupled to a cleavable fluorophore (e.g., coumarin), such as N-(4-methyl-7-aminocoumarinyl)-Nα-(t-butoxycarbonyl)-Nω-acetyllysineamide (MAL)16. To distinguish between isoform-specific activities, separate cell-free assays involving each isoform are necessary and might not reflect the real isoform activity in living cells. Isoform-specific substrates are commercially available, such as benzyl (S)-[1-(4-methyl-2-oxo-2H-chromen-7-ylcarbamoyl)-5-propionylaminopentyl]carbamate (MOCPAC, HDAC1 specific substrate) and (S)-[5-acetylamino-1-(2-oxo-4-trifluoromethyl-2H-chromen-7-ylcarbamoyl)pentyl]carbamic acid tert-butyl ester (BATCP, HDAC6 specific substrate) (Figure 1B). However, a multi-substrate mixture containing MAL, MOCPAC, and BATCP given to living cells will not permit the detection of the individual deacetylated products by fluorometric measurement, given that they bear the same cleavable fluorophore.
The method described here allows for the detection and relative quantification of each substrate and its deacetylated product in HeLa cells using a multi-substrate assay followed by UHPLC-ESI-MS/MS analysis17. An HDAC assay is conducted on HeLa cells to enable the direct identification of HDAC inhibitory activity and of the specificity of test compounds on endogenous HDACs. There is a focus on HDAC1 and HDAC6, which are simultaneously evaluated. To achieve these enzymatic measurements in a single incubation assay, a mixture of non-specific and specific HDAC substrates is added to treated and untreated HeLa cells plated on a 96-well plate. Following an incubation step, cells are lysed to release the substrates and their respective reaction products, which are separated and detected using a UHPLC-MS method (Figure 1C). The deacetylated products of the MAL, MOCPAC, and BATCP substrates are the deacetylated MAL (dMAL), deacetylated MOCPAC (dMOCPAC), and deacetylated BATCP (dBATCP), respectively. Dose-response curves can be built with active compounds.

Figure 1: General scheme for the cell-based HDAC assay to identify HDAC1- and HDAC6-specific inhibitors by the UHPLC-MS analysis of multiple substrates. (A) Scheme of a typical 96-well plate containing treated (test compounds) and untreated (control) HeLa cells, as well as cell-free blanks. (B) Chemical structure of substrates added as a mixture (21 µM each) to be deacetylated by endogenous HDACs. (C) Typical UHPLC-MS chromatogram showing the peaks of the added substrates (MAL, MOCPAC, and BATCP) and their deacetylated products (dMAL, dMOCPAC, and dBACTP, respectively). Please click here to view a larger version of this figure.
Access restricted. Please log in or start a trial to view this content.
Protocol
1. Cell Culture
NOTE: The following steps are performed in a standard tissue culture hood. Familiarity with sterile technique is expected.
- Culture HeLa cells to 80% confluency in a T75 cell culture flask in MEM supplemented with 10% fetal bovine serum, penicillin G (100 U/mL), and streptomycin (100 mg/mL).
NOTE: Cell culture, treatment, and lysis steps are conducted under laminar flow, with cell incubation steps at 37 °C performed in a humidified atmosphere of 5% CO2 under sterile conditions. - Wash the cells twice with 5 mL of DPBS, aspirate the DPBS, and add 1 mL of cell dissociation reagent. Incubate at 37 °C for 5 min to detach the cells.
- Add 9 mL of MEM culture medium, thoroughly resuspend the cell suspension, and count the cells using a hemocytometer.
- Adjust the density of the cell suspension to 6 x 10⁴ cells/mL in MEM.
- Add 100 µL of cell suspension to control and test the wells of a sterile, flat-bottom, tissue culture-treated 96-well plate (Figure 1A).
- Add 100 µL of MEM culture medium to blank wells of the 96-well plate (Figure 1A).
- Incubate the 96-well plate at 37 °C for 24 h.
NOTE: A 24 h incubation is a suitable time to test for endogenous HDAC activity in HeLa cells. Different cell types with unknown HDAC activity may need a timecourse evaluation of control cells.
2. Cell Treatment with Test Compounds and HDAC Substrates
- Aspirate the medium from the wells of the 96-well plate.
- Add 25 µL of 2x test compounds (e.g., trichostatin A, MS275, and tubastatin A) in MEM to test wells. Add 25 µL of MEM to control and blank wells.
NOTE: The concentration of test compounds is to be adjusted to provide a range of at least 5 final test concentrations (one concentration per well). The DMSO final concentration in the test compound should not exceed 0.5% and should be the same in each well, including blanks and controls. The final incubation volume is 50 µL per well. Trichostatin A is tested at 5 concentrations ranging from 500 to 1.95 nM (1:4 dilution). MS275 and tubastatin A are tested at 5 concentrations ranging from 8,000 to 6.17 nM (1:6 dilution). The desired final test concentration for each test compound should be determined by each individual user by creating a dose-response curve. - Add 25 µL of the substrate mixture (42 µM of MAL, 42 µM of MOCPAC, and 42 µM of BATCP in MEM) to control and test wells. Add 25 µL of MEM to blank wells.
NOTE: The final concentration of each substrate is 21 µM. MOCPAC and BATCP distinguish between HDAC1 and HDAC6 activity, respectively (Figure 1B). When no activity is observed with those substrates, the use of MAL could potentially lead to the identification of activity against another HDAC isoform. - Incubate the 96-well plate at 37 °C for 8 h in a humidified 5% CO2 incubator.
NOTE: This incubation time is suitable for HeLa cells and allows the endogenous HDAC to interact with the synthetic substrates. Different cell lines may require adjustments in incubation time and/or substrate concentration.
3. Cell Lysis and Sample Preparation for UHPLC-ESI-MS/MS
Caution: The sample preparation steps use organic chemicals, which are highly flammable and toxic by ingestion or inhalation. Wear appropriate personal protection, such as gloves and safety glasses.
- Add 10 µL of 6x RIPA buffer (diluted from 10x RIPA buffer) supplemented with protease inhibitor to each well of the 96-well plate.
- Stop the reaction by adding 160 µL of cold acetonitrile to each well and mix by pipetting up and down.
NOTE: Keep the acetonitrile at -20 °C prior to this step. - Place the plate in a -80 °C freezer for 10 min.
- Remove the plate from the freezer and transfer 220 µL of the content of each well to a non-sterile, conical-bottom (V-bottom) 96-well plate. Centrifuge the plate at 5,000 x g and 4 °C for 10 min.
NOTE: This step aims at removing proteins and salts. If necessary, the solutions can be transferred to individual conical centrifuge tubes prior to centrifugation or filtered through a set of 96-well, 0.65 µm PVDF filter plates. The successful removal of the precipitate is required prior to UHPLC analysis. - Transfer 200 µL of supernatant (or filtrate) into a 96-well plate compatible with the UHPLC system and seal it with peelable, heat-sealing foil using a plate sealer.
NOTE: Avoid pipetting the pellets when removing the supernatants. If the UHPLC analysis cannot be immediately performed, the plate can be stored at 4 °C for a maximum of 24 h until analysis.
4. UHPLC/MS-MS Analysis
- Prepare the UHPLC system by filling it with the mobile phase system (95% A:5% B):
A: H2O, HPLC-grade, containing 0.1% formic acid (prepare 1 L)
B: Acetonitrile, HPLC-grade, containing 0.1% formic acid (prepare 1 L).
Caution: The mobile phase contains organic chemicals, which are highly flammable and toxic by ingestion or inhalation. Wear appropriate personal protection, such as gloves and safety glasses. - Place the 96-well plate into the sample manager containing a plate holder. Run the samples according to the UHPLC-ESI-MS/MS conditions provided in Table 1.
NOTE: Every column of the analytical 96-well plate should have one control well and one blank well (as depicted in the plate scheme of Figure 1A). Controls are representative of 100% enzymatic activity in the tested cell line, while blanks are there to check whether the MS source is providing consistent background. Unusual MS peaks detected in a given blank should be investigated to prevent MS sensitivity changes.
5. Data Analysis
- Integrate the peak area of each substrate and its deacetylated product with an appropriate UHPLC integration software.
NOTE: Use automatic integration parameters with a smoothing method (Mean, window size 3, and number of smooth 2, for example). Using the chromatographic conditions provided in Table 1, the elution order is dMAL (5.8 min), dBATCP (6.0 min), dMOCPAC (6.2 min), MAL (7.6 min), MOCPAC (8.9 min), and BATCP (9.8 min), as depicted in Figure 1C. - For each substrate, calculate the peak area ratio (deacetylated/acetylated) in each chromatogram (test and control samples).
- Calculate the percent HDAC inhibition of each test sample:

NOTE: HDAC1 inhibition is calculated using the peak area ratio of dMOCPAC/MOCPAC; HDAC6 inhibition is calculated with dBATCP/BATCP. The ratio dMAL/MAL can be used to express general HDAC inhibition.
Access restricted. Please log in or start a trial to view this content.
Results
To demonstrate the application of the method to identifying non-selective and selective inhibitors for HDAC1 (class I) and HDAC6 (class IIb), HeLa cells were treated with known standard compounds: trichostatin A (non-selective between HDAC1 and HDAC6)18, MS275 (HDAC1-selective inhibitor)19, and tubastatin A (HDAC6-selective inhibitor)20. By using the present method (Figure 1), IC50
Access restricted. Please log in or start a trial to view this content.
Discussion
HDAC inhibition is a hot topic in drug discovery, with a current focus on HDAC6-selective inhibitors for cancer therapy21. HDAC selectivity is usually assessed by a series of high-throughput, cell-free assays, which intend to determine the inhibitory potency towards individual HDAC isoforms21. However, the selectivity of an inhibitor must be additionally confirmed in living cells by evaluating the acetylation status of endogenous protein substrates, such as histones (for cl...
Access restricted. Please log in or start a trial to view this content.
Disclosures
The authors have nothing to disclose.
Acknowledgements
The authors acknowledge COST Action CM1406 (Epigenetic Chemical Biology). Research reported in this publication was supported by the Pierre Mercier foundation.
Access restricted. Please log in or start a trial to view this content.
Materials
| Name | Company | Catalog Number | Comments |
| BATCP | Sigma-Aldrich | B4061 | |
| MAL | Sigma-Aldrich | SCP0168 | Synonym: BOC-Ac-Lys-AMC |
| MOCPAC | Sigma-Aldrich | M2195 | |
| MS275 | Sigma-Aldrich | EPS002 | |
| Trichostatin A | Sigma-Aldrich | T8552 | |
| Tubastatin A | Sigma-Aldrich | SML0044 | |
| Acetonitrile, HPLC grade | Fisher Scientific | 10660131 | |
| Formic acid, LC/MS grade | Fisher Scientific | 10596814 | |
| H2O, HPLC grade | distilled H2O filtered through a Milli-Q purification system | ||
| HeLa cells | ATCC | ATCC CRM-CCL-2 | |
| Cell dissociation reagent TrypLE Express | ThermoFisher Scientific | 12604013 | |
| DMSO, cell culture grade | Applichem | 146463 | |
| DPBS | ThermoFisher Scientific | 14190144 | |
| Fetal bovine serum | Biowest | S1810 | |
| MEM | ThermoFisher Scientific | 22561021 | |
| Penicillin-Streptomycin | Bioconcept | 4-01F00-H | |
| 10x RIPA buffer | Abcam | ab156034 | |
| SigmaFast protease inhibitor tablets | Sigma-Aldrich | S8820 | |
| 96-well plates, sterile, flat-bottom, tissue culture treated Corning | VWR | 29442-058 | |
| 96-well plates, non-sterile, V-bottom Corning | VWR | 29442-404 | used in the centrifugation step |
| 96-well plate, conical bottom, Nunc | ThermoFisher Scientific | 249944 | compatible with the Acquity UHPLC system |
| T75 cell culture flasks Corning | Sigma-Aldrich | CLS430641 | |
| Peelable heat sealing foil | Waters | 186002789 | |
| Acquity UPLC system | Waters | ||
| Eppendorf Centrifuge 5810 R | Fisher Scientific | 05-413-323 | |
| Integration software: MassLynx V4.1 | Waters | Catalog number not available | |
| Combi thermo-sealer SP-0669/240 | Waters | Catalog number not available | |
| Quattro micro API Tandem Quadrupole System | Waters | Catalog number not available |
References
- Arrowsmith, C. H., Bountra, C., Fish, P. V., Lee, K., Schapira, M. Epigenetic protein families: a new frontier for drug discovery. Nat Rev Drug Discov. 11 (5), 384-400 (2012).
- Henikoff, S., Greally, J. M. Epigenetics, cellular memory and gene regulation. Curr Biol. 26 (14), R644-R648 (2016).
- Kim, C., et al. HDAC6 inhibitor blocks amyloid beta-induced impairment of mitochondrial transport in hippocampal neurons. PLoS One. 7 (8), (2012).
- Kawaguchi, Y., et al. The deacetylase HDAC6 regulates aggresome formation and cell viability in response to misfolded protein stress. Cell. 115 (6), 727-738 (2003).
- Zhao, Y., et al. Acetylation of p53 at lysine 373/382 by the histone deacetylase inhibitor depsipeptide induces expression of p21(Waf1/Cip1). Mol Cell Biol. 26 (7), 2782-2790 (2006).
- Berger, S. L. Histone modifications in transcriptional regulation. Curr Opin Genet Dev. 12 (2), 142-148 (2002).
- Simões-Pires, C., et al. HDAC6 as a target for neurodegenerative diseases: what makes it different from the other HDACs? Mol Neurodegener. 8 (7), 1-16 (2013).
- Mottamal, M., Zheng, S., Huang, T. L., Wang, G. Histone deacetylase inhibitors in clinical studies as templates for new anticancer agents. Molecules. 20 (3), 3898-3941 (2015).
- Manal, M., Chandrasekar, M. J., Gomathi Priya, J., Nanjan, M. J. Inhibitors of histone deacetylase as antitumor agents: A critical review. Bioorg Chem. 67, 18-42 (2016).
- Mack, G. S. To selectivity and beyond. Nat Biotech. 28 (12), 1259-1266 (2010).
- U.S. National Institutes of Health. Study of ACY-1215 alone and in combination with bortezomib and dexamethasone in multiple myeloma (ACY-1215). , Available from: https://clinicaltrials.gov/ct2/show/NCT01323751 (1211).
- U.S. National Institutes of Health. Study of ACY-1215 in combination with lenalidomide, and dexamethasone in multiple myeloma. , Available from: https://clinicaltrials.gov/ct2/show/NCT01583283 (2012).
- U.S. National Institutes of Health. 13ACY-1215 (ricolinostat) in combination with pomalidomide and low-dose dex in relapsed-and-refractory multiple myeloma. , Available from: https://clinicaltrials.gov/ct2/show/NCT01997840 (2013).
- U.S. National Institutes of Health. Study of ACY-241 alone and in combination with pomalidomide and dexamethasone in multiple myeloma. , Available from: https://clinicaltrials.gov/ct2/show/NCT02400242 (2015).
- Yee, A. J., et al. Ricolinostat plus lenalidomide, and dexamethasone in relapsed or refractory multiple myeloma: a multicentre phase 1b trial. Lancet Oncol. 17 (11), 1569-1578 (2016).
- Jung, M. Homogenous non-isotopic assays for histone deacetylase activity. Expert Opin Ther Pat. 13 (6), 935(2003).
- Zwick, V., Simões-Pires, C., Cuendet, M. Cell-based multi-substrate assay coupled to UHPLC-ESI-MS/MS for a quick identification of class-specific HDAC inhibitors. J Enzyme Inhibi Med Chem. 31 (1), 209-214 (2016).
- Khan, N., et al. Determination of the class and isoform selectivity of small-molecule histone deacetylase inhibitors. Biochem J. 409 (2), 581-589 (2008).
- Glaser, K. B., et al. Differential protein acetylation induced by novel histone deacetylase inhibitors. Biochem Biophys Res Commun. 325 (3), 683-690 (2004).
- Butler, K. V., et al. Rational design and simple chemistry yield a superior, neuroprotective HDAC6 inhibitor, tubastatin A. J Am Chem Soc. 132 (31), 10842-10846 (2010).
- Jung, M., Yong, K. -J., Velena, A., Lee, S. Cell-Based Assays for HDAC Inhibitor Hit Validation. Epigenetic Targets in Drug Discovery. Sippl, W., Jung, M. , Wiley-VCH. (2010).
- Milli, A., et al. Proteomic analysis of cellular response to novel proapoptotic agents related to atypical retinoids in human IGROV-1 ovarian carcinoma cells. J Proteome Res. 10 (3), 1191-1207 (2011).
- Zwick, V., et al. Synthesis of a selective HDAC6 inhibitor active in neuroblasts. Bioorg Med Chem Lett. 26 (20), 4955-4959 (2016).
- Ciossek, T., Julius, H., Wieland, H., Maier, T., Beckers, T. A homogeneous cellular histone deacetylase assay suitable for compound profiling and robotic screening. Anal Biochem. 372 (1), 72-81 (2008).
- Heltweg, B., Dequiedt, F., Marshall, B. L., Brauch, C., Yoshida, M., et al. Subtype selective substrates for histone deacetylases. J Med Chem. 47 (21), 5235-5243 (2004).
- Copeland, R. A. Evaluation of enzyme inhibitors in drug discovery. , Wiley. (2005).
Access restricted. Please log in or start a trial to view this content.
Reprints and Permissions
Request permission to reuse the text or figures of this JoVE article
Request PermissionThis article has been published
Video Coming Soon
Copyright © 2025 MyJoVE Corporation. All rights reserved