
A subscription to JoVE is required to view this content. Sign in or start your free trial.
Method Article
Tactile Vibrating Toolkit and Driving Simulation Platform for Driving-Related Research
In This Article
Erratum Notice
Summary
This protocol describes a driving simulation platform and a tactile vibrating toolkit for the investigation of driving-related research. An exemplar experiment exploring the effectiveness of tactile warnings is also presented.
Abstract
Collision warning system plays a key role in the prevention of driving distractions and drowsy driving. Previous studies have proven the advantages of tactile warnings in reducing driver’s brake response time. At the same time, tactile warnings have been proved effective in take-over request (TOR) for partially autonomous vehicles.
How the performance of tactile warnings can be optimized is an ongoing hot research topic in this field. Thus, the presented low-cost driving simulation software and methods are introduced to attract more researchers to take part in the investigation. The presented protocol has been divided into five sections: 1) participants, 2) driving simulation software configuration, 3) driving simulator preparation, 4) vibrating toolkit configuration and preparation, and 5) conducting the experiment.
In the exemplar study, participants wore the tactile vibrating toolkit and performed an established car-following task using the customized driving simulation software. The front vehicle braked intermittently, and vibrating warnings were delivered whenever the front vehicle was braking. Participants were instructed to respond as quickly as possible to the sudden brakes of the front vehicle. Driving dynamics, such as the brake response time and brake response rate, were recorded by the simulation software for data analysis.
The presented protocol offers insight into the exploration of the effectiveness of tactile warnings on different body locations. In addition to the car-following task that is demonstrated in the exemplar experiment, this protocol also provides options to apply other paradigms to the driving simulation studies by making simple software configuration without any code development. However, it is important to note that due to its affordable price, the driving simulation software and hardware introduced here may not be able to fully compete with other high-fidelity commercial driving simulators. Nevertheless, this protocol can act as an affordable and user-friendly alternative to the general high-fidelity commercial driving simulators.
Introduction
According to the data revealed by the Global Health Estimates in 2016, traffic injury is the eighth cause of global deaths, leading to 1.4 million deaths worldwide1. In the year 2018, 39.2% of the traffic accidents were collisions with motor vehicles in transport, and 7.2% of which were rear-end collisions. A solution to increase vehicle and road safety is the development of an advanced driving assistance system (ADAS) to warn drivers with potential hazards. Data has shown that ADAS can greatly reduce the rate of rear-end collisions, and it is even more effective when equipped with an auto brake system2. In addition, with the development of autonomous vehicles, less human involvement will be required to control the vehicle, making a take-over request (TOR) warning system a necessity when the autonomous vehicle fails to regulate itself. The design of ADAS and TOR warning system is now an important piece of technology for drivers to avoid imminent accidents within a few seconds. The exemplar experiment used a vibrating toolkit along with a driving simulation platform to investigate which location would generate the best outcome when a vibrotactile warning system has been used as a potential ADAS and TOR warning system.
Categorized by perceptual channels, there are generally three types of warning modalities, that is visual, auditory, and tactile. Each warning modality has its own merits and limitations. When visual warning systems are in use, drivers can suffer from visual overload3, impairing driving performances due to inattentional blindness4,5. Although an auditory warning system does not influence drivers' visual field, its effectiveness greatly depends on the surroundings such as background music and other noises in the driving environment6,7. Thus, situations that contain other external auditory information or significant noise may lead to inattentional deafness8,9, reducing the effectiveness of an auditory warning system. In comparison, tactile warning systems do not compete with drivers’ visual or auditory processing. By sending vibrotactile warnings to drivers, tactile warning systems overcome the limitations of visual and auditory warning systems.
Previous studies showed that tactile warnings can benefit drivers by shortening their brake response time. It was also found that tactile warning systems yield a more effective result over visual10,11 and auditory12,13,14 warning systems in certain situations. However, limited research has focused on investigating the optimal location for placing a tactile warning device. According to sensory cortex hypothesis15 and sensory distance hypothesis16, the exemplar study chose the finger, wrist, and temple areas as the experimental locations for placing a tactile warning device. With the introduced protocol, the frequency and delivering time of a vibrating warning, and intervals between vibrations of the vibrating toolkit, can be configured to fit the experimental requirements. This vibrating toolkit consisted of a master chip, a voltage regulator chip, a multiplexer, a USB to Transistor-Transistor-Logic (TTL) adapter, a Metal-Oxide-Semiconductor Field-Effect Transistor (MOSFET), and a Bluetooth module. The number of vibrating modules can also vary according to researchers’ needs, with up to four modules vibrating at the same time. When implementing the vibrating toolkit in the driving-related experiments, it can be configured to fit the experimental settings as well as synchronized with driving performance data by revising the codes of the driving simulation.
While for researchers, conducting a driving experiment on a virtual platform is more feasible than in the real world due to the risk and cost involved. For instance, collecting performance indicators can be difficult, and it is hard to control the environmental factors involved when experiments are being conducted in the real-world. As a result, many studies have used fixed-base driving simulators running on PCs in recent years as an alternative to conduct on-road driving studies. After learning, developing, and researching for over 11 years in the driving research community, we established a driving simulation platform with a real car that consists of an open-source driving simulation software and a hardware kit, including a steering wheel and gearbox, three pedals, three mounted projectors, and three projector screens. With the driving simulation software supports only a single screen, the presented protocol used only the central projector and projector screen to conduct the experiment.
There are two major advantages of using the presented driving simulation platform. One advantage of this platform is that it uses an open-source software. Using the user-friendly open-source platform, researchers can customize the simulation and vibrating toolkit for their unique research needs by making simple software configuration without any code development . By revising the codes, researchers can create driving simulations that provide relative fidelity to the reality with plenty of options available on car types, road types, resistance of the steering wheel, lateral and longitudinal wind turbulence, time and brake event application program interfaces (APIs) for external software synchronization, and implementation of the behavioral paradigms such as car-following task and N-Back task. Although conducting driving-related research in a driving simulator cannot fully replicate driving in the real world, data collected through a driving simulator is reasonable and has been widely adopted by researchers17,18.
Another advantage of the proposed driving simulator is its low cost. As mentioned previously, the introduced driving simulation software is an open-source software that is available to users free of charge. In addition, the total cost of the whole hardware setup in this protocol is lower compare to typical high-fidelity commercial driving simulators. Figure 1 a and b show the complete setup of two driving simulators with the cost ranging from $3000 to $30000. In contrast, typical high-fidelity commercial driving simulators (fixed-base) usually cost around $10,000 to $100,000. With its highly affordable price, this driving simulator can be a popular choice not only for academic research purposes, but also for conducting driving classes19 and for demonstration of driving-related technologies20,21.

Figure 1: An image of the driving simulators. Both driving simulators consisted of a steering wheel and gearbox, three pedals, and a vehicle. (a) A $3000 driving simulator setup that used an 80-inch LCD screen with a resolution of 3840 × 2160. (b) A $30000 driving simulator setup that used three mounted projectors and three projector screens with a dimension of 223 x 126 cm each. The projection screens were placed 60 cm above ground and 22 cm away from the front of the vehicle. Only the central projector and projector screen were used for the current experiment. Please click here to view a larger version of this figure.
The driving simulation software and vibrating toolkit in the proposed method have already been used in previous studies by our researchers22,23,24,25,26,27,28,29. This self-developed vibrating toolkit following the ISO standard30 can be applied in different fields31,32 by adjusting the vibration frequency and intensity. It is important to note that a newer version of the vibrating toolkit has been developed and is introduced in the following protocol. Instead of adjusting the vibration frequency using an adjustable voltage adapter, the newer version is equipped with five different vibration frequencies and can be easier adjusted using the codes provided in Supplemental Coding File 1. Moreover, the presented driving simulator provides researchers with a safe, inexpensive, and effective way to investigate various kinds of driving-related research. Thus, this protocol is suitable for research laboratories that have a limited budget and have a strong need to customize experimental driving environments.
Protocol
NOTE: All methods described here have been approved by the Institutional Review Board (IRB) of Tsinghua University and informed consent was obtained from all participants.
1. Participants
- Conduct a power analysis to calculate the required number of participants for recruitment according to the experimental design to achieve statistical power.
- Balance the gender of the participants during recruitment as much as possible.
- Ensure that participants have a valid driving license and at least one year of driving experience.
- Ensure that the participants have normal or corrected to normal vision using the vision chart.
- Ensure that the participants did not consume alcohol or drugs that affect driving abilities within 24 h before the experiment33.
2. Driving simulation software configuration
- Enter the folder of the driving simulation software, followed by the Runtime folder and the Config folder. Then, open the “expconfig.txt” file (i.e., the file path should be “\torcs-1.3.3-Exp-2018-10-25\torcs-1.3.3\nuntime\config\”).
- Determine whether to apply any configuration or to proceed with the driving simulation using the default settings without any configuration fresh out of the box by referring to the experimental design. Table 1 shows a detailed description of the default configurations of all the available options.
- Proceed to Section 3 of the protocol if no changes are to be made.
| Configurable Options | Descriptions | Default Settings |
| endExpByTime | Whether or not to use clock time as a trigger to end experiment. | False |
| endExpAfterMinute | End the experiment after these minutes. | 10 |
| endExpByDist | Whether or not to use driver's car travelled distance as a trigger to end experiment. When both time and distance triggers are used, end the experiment with the one occurs first. | False |
| endExpAfterMeter | End the experiment after these meters have been travelled from the start line. | 5000 |
| enableRandomFrontalWind | Whether to enable frontal wind, (i.e. a force pushing the car to the rear direction) with random interval and duration. | True |
| frontalWindIntervalMin | Minimum value (seconds) of the frontal wind interval. | 3 |
| frontalWindIntervalMax | Maximum value (seconds) of the frontal wind interval. | 13 |
| frontalWindDurationMin | Minimum value (seconds) of the frontal wind duration. | 2 |
| frontalWindDurationMax | Maximum value (seconds) of the frontal wind duration. | 3 |
| frontalWindForceMin | Minimum value (newton) of the frontal wind force. | 500 |
| frontalWindForceMax | Maximum value (newton) of the frontal wind force. | 1000 |
| enableRandomLateralWind | Whether to enable lateral wind (i.e. a force pushing the car to the left or right direction) with random interval and duration. | True |
| lateralWindIntervalMin | Minimum value (seconds) of the lateral wind interval. | 3 |
| lateralWindIntervalMax | Maximum value (seconds) of the lateral wind interval. | 8 |
| lateralWindDurationMin | Minimum value (seconds) of the lateral wind duration. | 2 |
| lateralWindDurationMax | Maximum value (seconds) of the lateral wind duration. | 3 |
| lateralWindForceMin | Minimum value (newton) of the lateral wind force. | 1000 |
| lateralWindForceMax | Maximum value (newton) of the lateral wind force. | 2000 |
| leadCarConstantSpeedMPH | Constant speed of the lead vehicle (mph). | 40 |
| leadDistToStartWaiting | The lead vehicle will start waiting for the driver’s vehicle when the distance (meters) between the lead vehicle’s tail and driver’s vehicle’s head is larger than the indicated number. | 100 |
| leadDistToStopWaiting | The lead car will wait until the distance (meters) ahead of the driver's car is smaller than this number. | 80 |
| leadCarBrakeIntervalTimeMin | Minimum random time interval (seconds) for the lead vehicle to brake. | 30 |
| leadCarBrakeIntervalTimeMax | Maximum random time interval (seconds) for the lead vehicle to brake. | 60 |
| leadCarBrakeEventDuration | The lead vehicle brake event duration (seconds). | 5 |
| enableRandomSMSSound | Whether to enable short message server notification sound played with random intervals. | False |
| randSMSIntervalMin | Minimum random time interval (seconds) from the onset of the first SMS notification to the onset of the second SMS notification. | 2 |
| randSMSIntervalMax | Maximum random time interval (seconds) from the onset of the first SMS notification to the onset of the second SMS notification. | 2 |
| enableRandomNbackSound | Whether to enable N-back number sound played with random intervals. | False |
| randNbackIntervalMin | Minimum random time interval (seconds) from the onset of the first sound to the onset of the second sound. | 2.33 |
| randNbackIntervalMax | Maximum random time interval (seconds) from the onset of the first sound to the onset of the second sound. | 2.33 |
| enableUDPSendData | Whether to enable time stamp data synchronization to a specific local network IP. | False |
| enableUDPSendDataAdStudy | Whether to enable data to be sent to the following IP for the advertisement study. Note: Conflict with enableUDPSendData. | False |
| UDPTargetIPa1 | IP address for the UDP transfer | / |
| UDPTargetIPa2 | ||
| UDPTargetIPa3 | ||
| UDPTargetIPa4 | ||
| UDPTargetPort | Target UDP port. | 1234 |
| UDPcycleNumber | Control how frequently the time stamp is sent. Data will be sent after every UDPcycleNumber of TORCS cycles with each cycle is usually 20 ms. | 1 |
| enableUDPQNConnection | Whether or not to enable QN-Java model drive simulation with the UDP server and client are the same computer. | False |
| UDPQNtoTORCSPort | The UDP QN port to the simulation port number. | 5678 |
| UDPTORCStoQNPort | The simulation port to UDP QN port number. | 8765 |
| leadCarBrakingByWebCommand | Whether to connect to a website for the lead vehicle’s braking signal. | False |
| Far_Point_Time_Ahead | The parameter used in vehicle control model. | 2 |
| enableCarFollowingTraining | Whether or not to enable the simulated car-following task in training mode. | / |
| carFollowingTrainingWarningInterval | Time interval from the last warning sound onset to the next warning sound onset of the training mode. | 2 |
Table 1: List of default settings for the driving simulation software. A list of the default values of all the associated configurable options of the driving simulation software along with a detailed description of each option.
- Configure the settings on how to end the experiment based on the decided control variable of the experimental design.
- Decide whether to use clock time as a trigger to end the experiment with the “endExpByTime =” option using either True or False as the choice of options. Set this option to False to replicate the exemplar study.
- Select whether to end the experiment with time traveled as a trigger with the “endExpAfterMinute =” option by inputting the number of minutes in the format with one decimal place. The time traveled can be decided entirely by the researchers. Input 12 to replicate the exemplar study.
- Set whether to end the experiment with distance traveled as a trigger with the “endExpByDist =” option using either True or False as the choice of options. Note that when both “endExpByTime =” and “endExpByDist =” options are set to True, the experiment will end with the condition which is met first. Set this option to True to replicate the exemplar study.
- Use the “endExpAfterMeter =” option to set the distance traveled from the starting line in meters in the format with one decimal place. The distance traveled can be decided entirely by the researchers. Input 10000.0 to replicate the exemplar study.
- Configure the wind settings for the simulated driving environment according to the wind speed34,35 designed for the virtual environment and the cognitive load36 to be initiated into the experiment.
- Set whether to enable frontal wind with random interval and duration with the “enableRandomFrontalWind =” option using either True or False as the choice of options. Set this option to True to replicate the exemplar study.
- Define the minimum and maximum frontal wind interval with the “frontalWindIntervalMin =” and “frontalWindIntervalMax =” options by inputting the number of seconds in the format with one decimal place, respectively. Use the default setting (i.e., 3.0 and 13.0, respectively) to replicate the exemplar study.
- Define the minimum and maximum frontal wind duration with the “frontalWindDurationMin =” and “frontalWindDurationMax =” options by inputting the number of seconds in the format with one decimal place, respectively. Use the default setting (i.e., 2.0 and 3.0, respectively) to replicate the exemplar study.
- Define the minimum and maximum frontal wind force with the “frontalWindForceMin =” and “frontalWindForceMax =” options by indicating the amount of force in newton, respectively. Use the default setting (i.e., 500.0 and 1,000.0, respectively) to replicate the exemplar study.
- Choose whether to enable lateral wind with random interval and duration with the “enableRandomLateralWind =” option using either True or False as the choice of options. Set to True to replicate the exemplar study.
- Define the minimum and maximum lateral wind force interval with the “lateralWindIntervalMin =” and “lateralWindIntervalMax =” options by inputting the number of seconds in the format with one decimal place, respectively. Use the default setting (i.e., 3.0 and 8.0, respectively) to replicate the exemplar study.
- Define the minimum and maximum lateral wind duration with the “lateralWindDurationMin =” and “lateralWindDurationMax =” options by inputting the number of seconds in the format with one decimal place, respectively. Use the default setting (i.e., 2.0 and 3.0, respectively) to replicate the exemplar study.
- Define the minimum and maximum lateral wind force with the “lateralWindForceMin =” and “lateralWindForceMax =” options by indicating the amount of force in newton, respectively. Use the default setting (i.e., 1,000.0 and 2,000.0, respectively) to replicate the exemplar study.
- Configure the settings for the simulated car-following task according to the experimental design and needs35.
- Set the constant speed of the lead vehicle in miles per hour with one decimal place using the “leadCarConstantSpeedMPH =” option. Input 40 to replicate the exemplar study.
- Define the distance in meters with one decimal place between the lead vehicle and driver’s vehicle to trigger the lead vehicle to start waiting for the driver’s vehicle to catch up, or to resume driving, with the “leadDistToStartWaiting =” and “ leadDistToStopWaiting =” options, respectively. Use the default setting (i.e., 100.0 and 80.0, respectively) to replicate the exemplar study.
- Set the maximum and minimum random time interval of the lead vehicle brake events with the options “leadCarBrakeIntervalTimeMin =” and “leadCarBrakeIntervalTimeMax =” by inputting the number of seconds in the format with one decimal place (e.g., 30.0 and 60.0), respectively. Use the default setting (i.e., 30.0 and 60.0 respectively) to replicate the exemplar study.
- Define the brake event duration with the “leadCarBrakeEventDuration =” option by entering the number of seconds in the format with one decimal place. Use the default setting (i.e., 5.0) to replicate the exemplar study.
- Configure the settings for random short message notification sound according to the experimental design and needs.
- Decide whether to enable short message service (SMS) notification sounds play with random intervals with True or False as the choice of options for the “enableRandomSMSSound =” option. Set the option to False to replicate the exemplar study.
- Define the minimum and maximum time interval from the onset of the first SMS notification to the onset of the second SMS notification using the “randSMSIntervalMin =” and “randSMSIntervalMax =” options, by indicating the number of seconds in the format with one decimal place (e.g., 5.0 and 10.0) respectively.
- Configure the settings for the simulated N-back task37 according to the experimental design and needs.
- Set N-back number sounds to play with random intervals with True or False as the choice of options for the “enableRandomNbackSound =” option. Set the option to False to replicate the exemplar study.
- Define the minimum and maximum time interval from the offset of the first sound to the onset of the second sound using the “randNbackIntervalMin =” and “randNbackIntervalMax =” options to indicate the number of seconds in the format with one decimal place (e.g., 5.0 and 10.0), respectively.
- Configure the User Datagram Protocol (UDP) settings if a UDP data transfer is required for the experiment.
- Decide whether to enable the UDP for data transfer by allowing time stamp data synchronization to a specific local network IP address via the “enableUDPSendData =” option by using True or False as the choice of options. Enable this option to replicate the exemplar study.
- Select whether to enable the UDP for data transfer to a specific IP address for an advertisement study via the “enableUDPSendDataAdStudy =” option using True or False as the choice of options. It is also be reminded that this option is conflicted with the “enableUDPSendData =” and both options cannot be set to True at the same time. Set the option to False to replicate the exemplar study.
- Define the IP address for the UDP transfer by specifying each section of the IP address using “UDPTargetIPa1 =”, “UDPTargetIPa2 =”, “UDPTargetIPa3 =”, and “UDPTargetIPa4 =”.
- Indicate the target port number under “UDPTargetPort =”.
- Set the frequency for the data to be sent under “UDPcycleNumber =” with any integer greater than or equal to “1” cycle in which, each cycle is 20 ms.
- Configure the UDP queuing network (QN) model38 connection with reference to the experimental design and needs.
- Set whether or not to enable the QN-Java model drive simulation in which, the UDP server and client are sharing the same computer, with the “enableUDPQNConnection =” option using True or False as the choice of options. Disable this option to replicate the exemplar study.
- Indicate the number from the UDP QN port to the simulation port under the “UDPQNtoTORCSPort =” option.
- Indicate the number from the simulation port to the UDP QN port under the “UDPTORCStoQNPort =” option.
- Configure whether to connect to a website for braking signals according to the experimental design under the “leadCarBrakingByWebCommand =” option using True or False as the choice of options. Please note that when this option is set to True, the “endExpByTime =” and “endExpAfterMinute =” will stop working. Set the option to False to replicate the exemplar study.
- Set whether to enable the simulated car-following task in training mode with the “enableCarFollowingTraining =” using True or False as the choice of options.
- Define the interval from the last warning sound onset to the next warning sound onset of the training with the “carFollowingTrainingWarningInterval =” option by indicating the number of seconds with one decimal place (e.g., 2.0).
- Save the file upon completing the configuration.
3. Driving simulator preparation
- Connect the steering wheel and the central projector (a mounted projector with an aspect ratio of 16:10, 192 – 240 Hz refresh frequency, and 8-bit color processing) to the computer. A projector screen with a dimension of 223 x 126 cm was placed 60 cm above the ground and 22 cm away from the front of the instrumented vehicle.
- Set the screen resolution under Options | Display, to match the screen size upon starting the driving simulation software.
- Enter the Configure page to select a player and follow the instructions provided by the software to calibrate the steering wheel, accelerator, and brake pedal. These include turning the steering wheel and pressing the accelerator and brake pedal as instructed.
4. Vibrating toolkit configuration and preparation
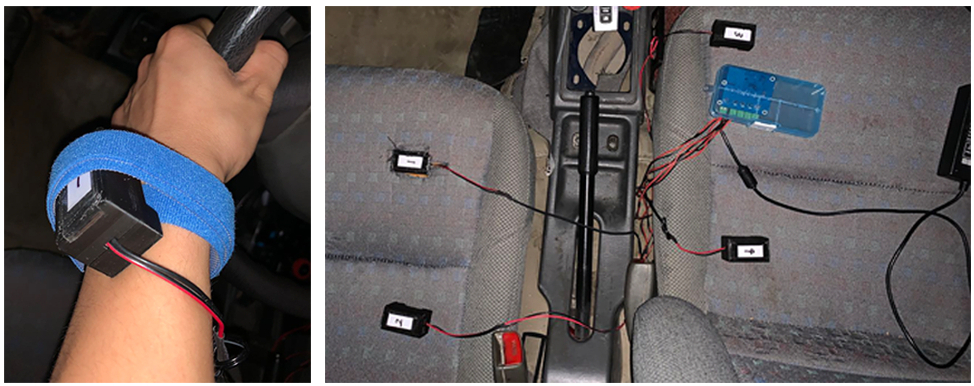
- Connect the vibrating toolkit to the power supply. Each of the four modules has a dimension of 67 x 57 x 29 mm. Figure 2 shows an image of the vibrating toolkit.

Figure 2: Images of the vibrating toolkit. The vibrating toolkit consisted of four individual modules that can be activated separately. Each module has a dimension of 67 x 57 x 29 mm. Please click here to view a larger version of this figure.
- Switch on the vibrating toolkit and connect the toolkit to the computer via Bluetooth.
- Define the vibration frequency to be used for the experiment upon completing a pilot skin sensitivity test or according to experimental needs.
- Set the vibration frequency to 70 Hz39,40,41 using the codes provided as Supplemental Coding File 1. A total of five frequency levels (i.e., 14Hz, 28Hz, 42Hz, 56Hz, and 70Hz) are currently available with each vibration stimulation that lasts for 0.5 s by default.
- Use the codes provided as Supplemental Coding File 1 to synchronize the brake events from the driving simulation software and vibrating toolkit. Figure 3 shows a labeled screenshot of the codes to be revised as a reference.

Figure 3: A labeled screenshot of the codes in Supplemental Coding File 1. The labeled screenshot of codes can be used as an easier reference for the vibrating toolkit configuration and preparation. These codes are used to set the vibration frequency of the toolkit, and to synchronize the brake events in the driving simulation software and vibrating toolkit to generate vibrating warnings. Please click here to view a larger version of this figure.
5. Conducting the experiment
- Instruct the participants to read and sign the informed consent form that introduces the experimental process and declare that the study is to evaluate driving performance upon arrival at the laboratory.
- Assist the participants to adjust the seat distance to the pedal and set the backrest to a comfortable position manually.
- Teach the participants how to operate the simulator, including the steering wheel, brake pedal, and accelerator pedal.
- Instruct the participants to drive as they would in the real world, following the car in front of them and keeping a two-second headway behind it. Figure 4 shows the road map used for the driving simulation.

Figure 4: Road map used for driving simulation. The road used is a one-way road with four curves (maximum length 15,000 meters), three lanes, and with no traffic lights. The driving simulator software offers other road design options such as options to include road signs or billboards. An EEG-compatible version is also available. All these parameters can be adjusted, if necessary. Please click here to view a larger version of this figure.
- Inform the participants to brake as soon as possible whenever the front vehicle brakes, even if the scenario does not require a brake response. The taillights of the front vehicle will light up as per real-world driving to indicate a brake event.
- Provide participants with a 5 min practice trial to learn to maintain a two-second headway distance behind the front vehicle. The practice trial includes a set of 5 random brakes.
- During the practice trial, if the participants are less than 1.5 s behind the front vehicle, the driving simulation software will play a prompt with a female voice "too close, please slow down".
- If the participants are between 2.25 to 2.5 s behind the front vehicle, the driving simulation software will play a prompt with a female voice "too far, please speed up".
- Do not include data from the practice trial for the analysis.
- Let the participants know that the study can be stopped without any penalty by notifying the experimenters at any time, if necessary.
- Begin the formal experiment once the participants have completed the practice session and can maintain a stable following distance.
- Start the formal experimental session, which consists of a total of four blocks (i.e., finger, wrist, temple, and driving-only) with 13 random braking events in each block, resulting in a total of 52 experimental trials. The order of conditions is counterbalanced with the Latin square design. No voice prompt is provided in the formal trials.
- Assist the participants to put on the vibrating toolkit using medical tape before each block of trials according to the conditions assigned. The vibrating toolkit (if worn) warns the participants to brake when the front vehicle is braking. The taillights of the front vehicle are illuminated every time the front vehicle brakes.
- Ensure that the participants are given a 2 min rest upon completion of each block to reduce carryover effects.
- Ask the participants for their preferred location for the vibrating toolkit and the perceived vibration intensity with a 7-point Likert scale upon completion of all trials. The usage rate of each daily wearable accessories (i.e., watch, glasses, earphones, and ring) is also recorded. In the preference scale for the location of the vibrating toolkit, "1" represents "least favorite" and "7" represents "most favorite", while in the vibration intensity scale "1" represents "weak feeling" and "7" represents "strong feeling".
6. Data analysis
- Collect the driving behavior data of the participants at 50 Hz using the driving simulation software, including the brake response time, vehicle speed, steering wheel reversal rate, lane position (SDLP), and headway distance, etc.
- Perform data analysis of the drivers' performance.
- Conduct an outlier analysis using the normal distribution with cut-off as three standard deviations from the mean to determine what data to be included for further analysis.
- Calculate the brake response time by subtracting the time when the participant vehicle brakes (i.e., a minimum reduction of 1% of the brake pedal36,42) from the time when the front vehicle starts to brake.
- Label the data as “no brake response” if the brake response time is larger than or equal to 5 s (i.e., a failure to brake within 5 s after the front vehicle brakes).
- Divide the number of successful brakes by the total number of brakes performed by the front vehicle to calculate the brake response rate.
- Average all the values of each participant to obtain the mean brake response rate and brake response time of each condition and compute the standard deviation on those values for further analyses.
Results
The exemplar study reported in this paper conducted the car-following task using the driving simulator and vibrating toolkit, which has also been published previously in an academic journal22. It is noteworthy that the older version of the vibrating toolkit was used when conducting the exemplar study, while a new version of the vibrating toolkit was introduced in the above protocol. The study was a within-subject design experiment with vibrating warning location as the only factor: finger, wr...
Discussion
The driving simulation platform and vibrating toolkit reasonably mimicked the application of potential wearable vibrotactile devices in real life, providing an effective technique in investigating driving-related research. With the use of this technology, a safe experimental environment with high configurability and affordability is now available for conducting research that is comparable to real-world driving.
There are several steps that require more attention. Firstly, during the ...
Disclosures
The authors declared no financial disclosure or conflicts of interest.
Acknowledgements
This project has been sponsored by Beijing Talents Foundation.
Materials
| Name | Company | Catalog Number | Comments |
| Logitech G29 | Logitech | 941-000114 | Steering wheel and pedals |
| Projector screens | - | - | The projector screen for showing the simulation enivronemnt. |
| Epson CB-700U Laser WUXGA Education Ultra Short Focus Interactive Projector | EPSON | V11H878520W | The projector model for generating the display of the simlution enivronment. |
| The Open Racing Car Simulator (TORCS) | - | None | Driving simulation software. The original creators are Eric Espié and Christophe Guionneau, and the version used in experiment is modified by Cao, Shi. |
| Tactile toolkit | Hao Xing Tech. | None | This is used to initiate warnings to the participants. |
| Connecting program (Python) | - | - | This is used to connect the TORCS with the tactile toolkit to send the vibrating instruction. |
| G*power | Heinrich-Heine-Universität Düsseldorf | None | This software is used to calculate the required number of participants. |
References
- The top 10 causes of death. World Health Organization Available from: https://www.who.int/news-room/fact-sheets/detail/the-top-10-causes-of-death (2018)
- . Insurance Institute for Highway Safety (IIHS) Available from: https://www.iihs.org/news/detail/gm-front-crash-prevention-systems-cut-police-reported-crashes (2018)
- Spence, C., Ho, C. Tactile and multisensory spatial warning signals for drivers. IEEE Transactions on Haptics. 1 (2), 121-129 (2008).
- Simons, D. J., Ambinder, M. S. Change blindness: theory and consequences. Current Directions in Psychological Science. 14 (1), 44-48 (2005).
- Mack, A., Rock, I. . Inattentional blindness. , (1998).
- Wilkins, P. A., Acton, W. I. Noise and accidents - A review. The Annals of Occupational Hygiene. 25 (3), 249-260 (1982).
- Mohebbi, R., Gray, R., Tan, H. Driver reaction time to tactile and auditory rear-end collision warnings while talking on a cell phone. Human Factors. 51 (1), 102-110 (2009).
- Macdonald, J. S. P., Lavie, N. Visual perceptual load induces inattentional deafness. Attention, Perception & Psychophysics. 73 (6), 1780-1789 (2011).
- Parks, N. A., Hilimire, M. R., Corballis, P. M. Visual perceptual load modulates an auditory microreflex. Psychophysiology. 46 (3), 498-501 (2009).
- Van Erp, J. B. F., Van Veen, H. A. H. C. Vibrotactile in-vehicle navigation system. Transportation Research Part F: Traffic Psychology and Behaviour. 7 (4), 247-256 (2004).
- Lylykangas, J., Surakka, V., Salminen, K., Farooq, A., Raisamo, R. Responses to visual, tactile and visual–tactile forward collision warnings while gaze on and off the road. Transportation Research Part F: Traffic Psychology and Behaviour. 40, 68-77 (2016).
- Halabi, O., Bahameish, M. A., Al-Naimi, L. T., Al-Kaabi, A. K. Response times for auditory and vibrotactile directional cues in different immersive displays. International Journal of Human-Computer Interaction. 35 (17), 1578-1585 (2019).
- Geitner, C., Biondi, F., Skrypchuk, L., Jennings, P., Birrell, S. The comparison of auditory, tactile, and multimodal warnings for the effective communication of unexpected events during an automated driving scenario. Transportation Research Part F: Traffic Psychology and Behaviour. 65, 23-33 (2019).
- Scott, J., Gray, R. A comparison of tactile, visual, and auditory warnings for rear-end collision prevention in simulated driving. Human Factors. 50, 264-275 (2008).
- Schott, G. D. Penfield's homunculus: a note on cerebral cartography. Journal of Neurology, Neurosurgery, and Psychiatry. 56 (4), 329-333 (1993).
- Harrar, V., Harris, L. R. Simultaneity constancy: detecting events with touch and vision. Experimental Brain Research. 166 (34), 465-473 (2005).
- Kaptein, N. A., Theeuwes, J., van der Horst, R. Driving simulator validity: Some considerations. Transportation Research Record. 1550 (1), 30-36 (1996).
- Reed, M. P., Green, P. A. Comparison of driving performance on-road and in a low-cost simulator using a concurrent telephone dialling task. Ergonomics. 42 (8), 1015-1037 (1999).
- Levy, S. T., et al. Designing for discovery learning of complexity principles of congestion by driving together in the TrafficJams simulation. Instructional Science. 46 (1), 105-132 (2018).
- Lehmuskoski, V., Niittymäki, J., Silfverberg, B. Microscopic simulation on high-class roads: Enhancement of environmental analyses and driving dynamics: Practical applications. Transportation Research Record. 1706 (1), 73-81 (2000).
- Onieva, E., Pelta, D. A., Alonso, J., Milanes, V., Perez, J. A modular parametric architecture for the TORCS racing engine. 2009 IEEE Symposium on Computational Intelligence and Games. , 256-262 (2009).
- Zhu, A., Cao, S., Yao, H., Jadliwala, M., He, J. Can wearable devices facilitate a driver's brake response time in a classic car-following task. IEEE Access. 8, 40081-40087 (2020).
- Deng, C., Cao, S., Wu, C., Lyu, N. Modeling driver take-over reaction time and emergency response time using an integrated cognitive architecture. Transportation Research Record: Journal of the Transportation Research Board. 2673 (12), 380-390 (2019).
- Deng, C., Cao, S., Wu, C., Lyu, N. Predicting drivers' direction sign reading reaction time using an integrated cognitive architecture. IET Intelligent Transport Systems. 13 (4), 622-627 (2019).
- Guo, Z., Pan, Y., Zhao, G., Cao, S., Zhang, J. Detection of driver vigilance level using EEG signals and driving contexts. IEEE Transactions on Reliability. 67 (1), 370-380 (2018).
- Cao, S., Qin, Y., Zhao, L., Shen, M. Modeling the development of vehicle lateral control skills in a cognitive architecture. Transportation Research Part F: Traffic Psychology and Behaviour. 32, 1-10 (2015).
- Cao, S., Qin, Y., Jin, X., Zhao, L., Shen, M. Effect of driving experience on collision avoidance braking: An experimental investigation and computational modelling. Behaviour & Information Technology. 33 (9), 929-940 (2014).
- He, J., et al. Texting while driving: Is speech-based text entry less risky than handheld text entry. Accident; Analysis and Prevention. 72, 287-295 (2014).
- Cao, S., Qin, Y., Shen, M. Modeling the effect of driving experience on lane keeping performance using ACT-R cognitive architecture. Chinese Science Bulletin (Chinese Version). 58 (21), 2078-2086 (2013).
- Hsu, W., et al. Controlled tactile and vibration feedback embedded in a smart knee brace. IEEE Consumer Electronics Magazine. 9 (1), 54-60 (2020).
- Dim, N. K., Ren, X. Investigation of suitable body parts for wearable vibration feedback in walking navigation. International Journal of Human-Computer Studies. 97, 34-44 (2017).
- Kenntner-Mabiala, R., Kaussner, Y., Jagiellowicz-Kaufmann, M., Hoffmann, S., Krüger, H. -. P. Driving performance under alcohol in simulated representative driving tasks: an alcohol calibration study for impairments related to medicinal drugs. Journal of Clinical Psychopharmacology. 35 (2), 134-142 (2015).
- . Royal Meteorological Society Available from: https://www.rmets.org/resource/beaufort-scale (2018)
- Kubose, T. T., et al. The effects of speech production and speech comprehension on simulated driving performance. Applied Cognitive Psychology. 20 (1), (2006).
- He, J., Mccarley, J. S., Kramer, A. F. Lane keeping under cognitive load: performance changes and mechanisms. Human Factors. 56 (2), 414-426 (2014).
- Radlmayr, J., Gold, C., Lorenz, L., Farid, M., Bengler, K. How traffic situations and non-driving related tasks affect the take-over quality in highly automated driving. Proceedings of the Human Factors and Ergonomics Society Annual Meeting. 58, 2063-2067 (2014).
- Cao, S., Liu, Y. Queueing network-adaptive control of thought rational (QN-ACTR): an integrated cognitive architecture for modelling complex cognitive and multi-task performance. International Journal of Human Factors Modelling and Simulation. 4, 63-86 (2013).
- Ackerley, R., Carlsson, I., Wester, H., Olausson, H., Backlund Wasling, H. Touch perceptions across skin sites: differences between sensitivity, direction discrimination and pleasantness. Frontiers in Behavioral Neuroscience. 8 (54), 1-10 (2014).
- Novich, S. D., Eagleman, D. M. Using space and time to encode vibrotactile information: toward an estimate of the skin's achievable throughput. Experimental Brain Research. 233 (10), 2777-2788 (2015).
- Gilhodes, J. C., Gurfinkel, V. S., Roll, J. P. Role of ia muscle spindle afferents in post-contraction and post-vibration motor effect genesis. Neuroscience Letters. 135 (2), 247-251 (1992).
- Strayer, D. L., Drews, F. A., Crouch, D. J. A comparison of the cell phone driver and the drunk driver. Human Factors. 48 (2), 381-391 (2006).
- Olejnik, S., Algina, J. Measures of effect size for comparative studies: applications, interpretations, and limitations. Contemporary Educational Psychology. 25 (3), 241-286 (2000).
- . Statistics Teacher Available from: https://www.statisticsteacher.org/2017/09/15/what-is-power/ (2017)
- Maurya, A., Bokare, P. Study of deceleration behaviour of different vehicle types. International Journal for Traffic and Transport Engineering. 2 (3), 253-270 (2012).
- Woodward, K. L. The relationship between skin compliance, age, gender, and tactile discriminative thresholds in humans. Somatosensory & Motor Research. 10 (1), 63-67 (1993).
- Stevens, J. C., Choo, K. K. Spatial acuity of the body surface over the life span. Somatosensory & Motor Research. 13 (2), 153-166 (1996).
- Bhat, G., Bhat, M., Kour, K., Shah, D. B. Density and structural variations of Meissner's corpuscle at different sites in human glabrous skin. Journal of the Anatomical Society of India. 57 (1), 30-33 (2008).
- Chentanez, T., et al. Reaction time, impulse speed, overall synaptic delay and number of synapses in tactile reaction neuronal circuits of normal subjects and thinner sniffers. Physiology & Behavior. 42 (5), 423-431 (1988).
- van Erp, J. B. F., van Veen, H. A. H. C. A multi-purpose tactile vest for astronauts in the international space station. Proceedings of Eurohaptics. , 405-408 (2003).
- Steffan, H. Accident investigation - determination of cause. Encyclopedia of Forensic Sciences (Second Edition). , 405-413 (2013).
- Galski, T., Ehle, H. T., Williams, J. B. Estimates of driving abilities and skills in different conditions. American Journal of Occupational Therapy. 52 (4), 268-275 (1998).
- Ihemedu-Steinke, Q. C., et al. Simulation sickness related to virtual reality driving simulation. Virtual, Augmented and Mixed Reality. , 521-532 (2017).
- Kennedy, R. S., Lane, N. E., Berbaum, K. S., Lilienthal, M. G. Simulator sickness questionnaire: an enhanced method for quantifying simulator sickness. The International Journal of Aviation Psychology. 3 (3), 203-220 (1993).
- Armagan, E., Kumbasar, T. A fuzzy logic based autonomous vehicle control system design in the TORCS environment. 2017 10th International Conference on Electrical and Electronics Engineering (ELECO). , 737-741 (2017).
- Hsieh, L., Seaman, S., Young, R. A surrogate test for cognitive demand: tactile detection response task (TDRT). Proceedings of SAE World Congress & Exhibition. , (2015).
- Bruyas, M. -. P., Dumont, L. Sensitivity of detection response task (DRT) to the driving demand and task difficulty. Proceedings of the 7th International Driving Symposium on Human Factors in Driver Assessment, Training, and Vehicle Design: Driving Assessment 2013. , 64-70 (2013).
- Conti-Kufner, A., Dlugosch, C., Vilimek, R., Keinath, A., Bengler, K. An assessment of cognitive workload using detection response tasks. Advances in Human Aspects of Road and Rail Transportation. , 735-743 (2012).
Erratum
Formal Correction: Erratum: Tactile Vibrating Toolkit and Driving Simulation Platform for Driving-Related Research
Posted by JoVE Editors on 9/01/2022. Citeable Link.
An erratum was issued for: Tactile Vibrating Toolkit and Driving Simulation Platform for Driving-Related Research. The Authors section was updated.
Ao Zhu1
Annebella Tsz Ho Choi1
Ko-Hsuan Ma1
Shi Cao2
Han Yao1
Jian Wu3
Jibo He4,1
1Psychology Department, School of Social Sciences, Tsinghua University
2Department of Systems Design Engineering, University of Waterloo
3Haier Innovation Design Center, Haier Company
4Psychology Department, School of Education and Psychological Sciences, Sichuan University of Science and Engineering
to:
Ao Zhu1
Annebella Tsz Ho Choi1
Ko-Hsuan Ma1
Shi Cao2
Han Yao1
Jian Wu3
Jibo He1
1Psychology Department, School of Social Sciences, Tsinghua University
2Department of Systems Design Engineering, University of Waterloo
3Haier Innovation Design Center, Haier Company
Reprints and Permissions
Request permission to reuse the text or figures of this JoVE article
Request PermissionThis article has been published
Video Coming Soon
Copyright © 2025 MyJoVE Corporation. All rights reserved