A subscription to JoVE is required to view this content. Sign in or start your free trial.
Methods Article
FLIM-FRET Measurements of Protein-Protein Interactions in Live Bacteria.
In This Article
Summary
We describe here a protocol to characterize protein-protein interactions between two highly-differently expressed proteins in live Pseudomonas aeruginosa using FLIM-FRET measurements. The protocol includes bacteria strain constructions, bacteria immobilization, imaging and post-imaging data analysis routines.
Abstract
Protein-protein interactions (PPIs) control various key processes in cells. Fluorescence lifetime imaging microscopy (FLIM) combined with Förster resonance energy transfer (FRET) provide accurate information about PPIs in live cells. FLIM-FRET relies on measuring the fluorescence lifetime decay of a FRET donor at each pixel of the FLIM image, providing quantitative and accurate information about PPIs and their spatial cellular organizations. We propose here a detailed protocol for FLIM-FRET measurements that we applied to monitor PPIs in live Pseudomonas aeruginosa in the particular case of two interacting proteins expressed with highly different copy numbers to demonstrate the quality and robustness of the technique at revealing critical features of PPIs. This protocol describes in detail all the necessary steps for PPI characterization - starting from bacterial mutant constructions up to the final analysis using recently developed tools providing advanced visualization possibilities for a straightforward interpretation of complex FLIM-FRET data.
Introduction
Protein-protein interactions (PPIs) control various key processes in cells1. The roles of PPIs differ based on protein composition, affinities functions and locations in cells2. PPIs can be investigated via different techniques3. For example, co-immunoprecipitation is a relatively simple, robust, and inexpensive technique commonly used tool to identify or confirm PPIs. However, studying PPIs can be challenging when the interacting proteins have low expression levels or when the interactions are transient or relevant only in specific environments. Studying PPIs occurring between the different enzymes of the pyoverdine pathway in P. aeruginosa requires that the repression of the general iron-co-factored repressor Fur is relieved to allow the expression of all the proteins of the pyoverdine pathway to be expressed in the cell4,5,6. This common regulation for all the proteins of the pathway results in timely expressions in the cell expected to promote their interactions. The diversity in term of size, nature, expression levels and the number of proteins of this metabolic pathway make it difficult for study in reconstituted systems6. Exploring PPIs in their cellular environment is therefore critical to further understand the biological functions of proteins in their native context.
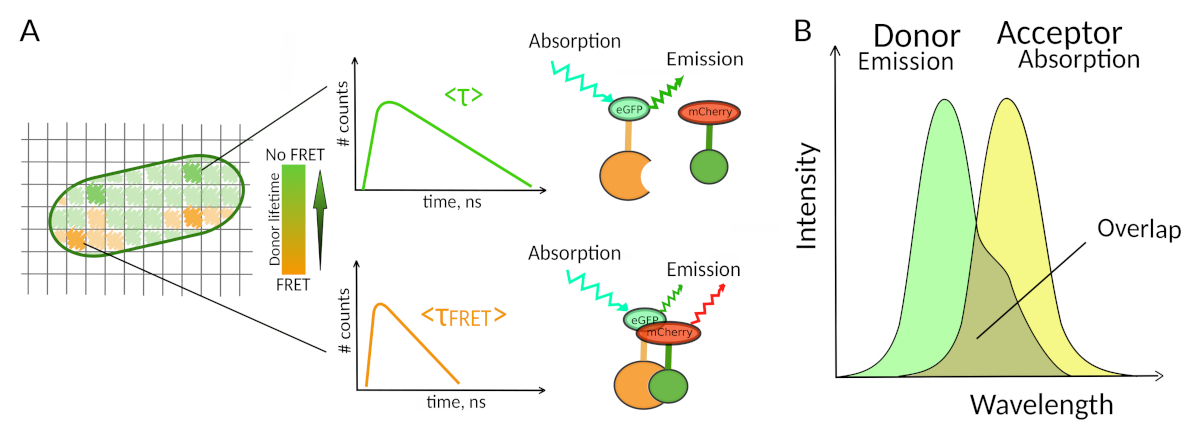
Only few methods including fluorescence allow exploring PPIs in living cells7. Amongst the different fluorescence parameters that can be measured, the fluorescence lifetime (i.e., the average time a fluorophore remains in its excited state before emitting a photon) is likely one of the most interesting parameters to explore in living cells. The fluorescence lifetime of a fluorophore is highly sensitive to its environment and FLIM can therefore provide chemical or physical information regarding the fluorophore surroundings8. This includes the presence of Förster resonance energy transfer (FRET) that can occur in the presence of an “acceptor” of fluorescence located at a short distance of a fluorescence “donor”. Energy transfer results in significant shortening of the donor fluorescence lifetime (Figure 1A), making Fluorescence Lifetime Imaging Microscopy (FLIM) a powerful approach to explore protein-protein interactions directly in live cells. FLIM can additionally provide spatial information about where the interactions take place in cells7,8. This approach is extremely powerful for investigating PPIs in situations where the labeling with fluorophores of the two interacting partners is possible.
For FRET to occur - critical conditions on the distance between two fluorophores are required8,9. The two fluorophores should not be distant from each other by more than 10 nm. Therefore, cautions must be taken when designing FLIM-FRET experiments to ensure that the donor and the acceptor of fluorescence have a chance to be located close to each other in the interacting complex. While this may seem constraining, it is in fact a true advantage as the distance-dependence of FRET ensures that two labelled proteins undergoing FRET have to physically interact (Figure 1A). The difficulties at getting clear answers about PPI in colocalization experiments (two colocalized proteins may not necessarily interact) are therefore not an issue using FLIM-FRET.

Figure 1: FLIM-FRET analysis principle. Each pixel of the FLIM-FRET multidimensional image contains information about the fluorescence decay recorded at this particular location (#counts = number of detected photons in the channel t). (A) The classical representation of the FLIM image is usually a false-color lifetime encoded 2D image (left). A decrease in the mean fluorescence lifetime of the donor - as seen by a change in the color scale - can be observed in the presence of FRET and is informative about the presence of PPIs in this spatial area. (B) Overlap between the donor emission spectrum and the acceptor absorption spectrum is necessary for FRET to occur. Please click here to view a larger version of this figure.
A second requirement for FRET is that the emission spectrum of the donor and the absorption spectra of the acceptor should overlap8 (Figure 1B). The fluorescence excitation of the donor should be at wavelengths that contribute very little to the direct fluorescence excitation of the acceptor. Not all combinations of fluorophores are possible and we additionally recommend to preferentially use donors with monoexponential fluorescence decays to facilitate FLIM-FRET interpretations10. Several couples of fluorescence proteins meet these requirements, including the popular eGFP-mCherry couple11 (for a review on the palette of available fluorescent protein FRET pairs see12,13).
FLIM-FRET allows measuring the fluorescence lifetime decay of a FRET donor at every pixel of a FLIM image (Figure 1A). There are two major techniques to determine fluorescence lifetime that differ in acquisition and analysis: frequency-domain (FD)14 and time-domain (TD). TD FLIM is more widespread and is performed using a pulsed illumination combined with different possible detection configurations including gating methods15, streak camera16 or time-correlated single photon counting (TCSPC) techniques8. For both FD and TD techniques, fluorescence lifetime is not directly measured but requires an analysis of the measured data to estimate the lifetime(s) or the presence of interactions. For TCSPC techniques, the most widely used analysis relies on fitting the decays with single or multi exponential functions using least square iterative re-convolutions that minimize the weighted sum of the residuals.
Finally, FLIM-FRET can be performed both by using single photon or multiphoton excitations. The latest have several advantages like reducing autofluorescence and photodamage out of the focal plane. Multiphoton excitations allow also a longer excitation depth if working in thick 3D samples8. On the contrary, single photon excitation is usually more efficient as the two-photon absorption cross sections of fluorescent proteins are limited17.
Here, we propose a protocol for FLIM-FRET measurements of PPIs in live P. aeruginosa in the particular case of two interacting proteins (PvdA and PvdL) expressed with highly different numbers of copies to demonstrate the quality and robustness of the technique at revealing critical features of PPIs. PvdA and PvdL proteins are involved in pyoverdine biosynthesis. PvdA is a L-ornithine N5-oxygenase and synthesizes the L-N5-formyl-N5-hydroxyornithine from L-ornithine by hydroxylation (PvdA) and formylation (PvdF)18. PvdL is a non-ribosomal peptide synthesis (NRPS) enzyme composed of four modules. The first module catalyzes the acylation of myristic acid. The second module catalyzes the activation of L-Glu and its condensation to the myristic-coA. Then, the third module condenses a L-Tyr amino acid that is then isomerized in D-Tyr. Finally, the fourth module binds a L-Dab (Diaminobutyric acid) amino acid to form the acylated tripeptide L-Glu/D-Tyr/L-Dab6. PvdL is thus responsible for the synthesis of the three first amino acids of the pyoverdine precursor. The interaction of PvdA protein with PvdL is surprising as PvdL, on the contrary to PvdI and PvdJ, does not carry a module specific for the L-N5-formyl-N5-hydroxyornithine. This interaction suggest that all the enzymes responsible for the pyoverdine precursor biosynthesis are arranged in large transient and dynamic multi-enzymatic complexes19,20.
In this report we explain in detail how to construct the bacterial strains expressing natively the two interacting eGFP and mCherry labelled proteins. We also describe sample preparation and conditions for efficient FLIM-FRET cell imaging. Finally, we propose a step-by-step tutorial for image analysis including a recently developed tool providing advanced visualization possibilities for straightforward interpretation of complex FLIM-FRET data. With this report, we would like to convince not only adventurous but most biologists that FRET-FLIM is an accessible and powerful technique able to address their questions about PPIs directly in the native cellular environment.
Protocol
1. Plasmid construction
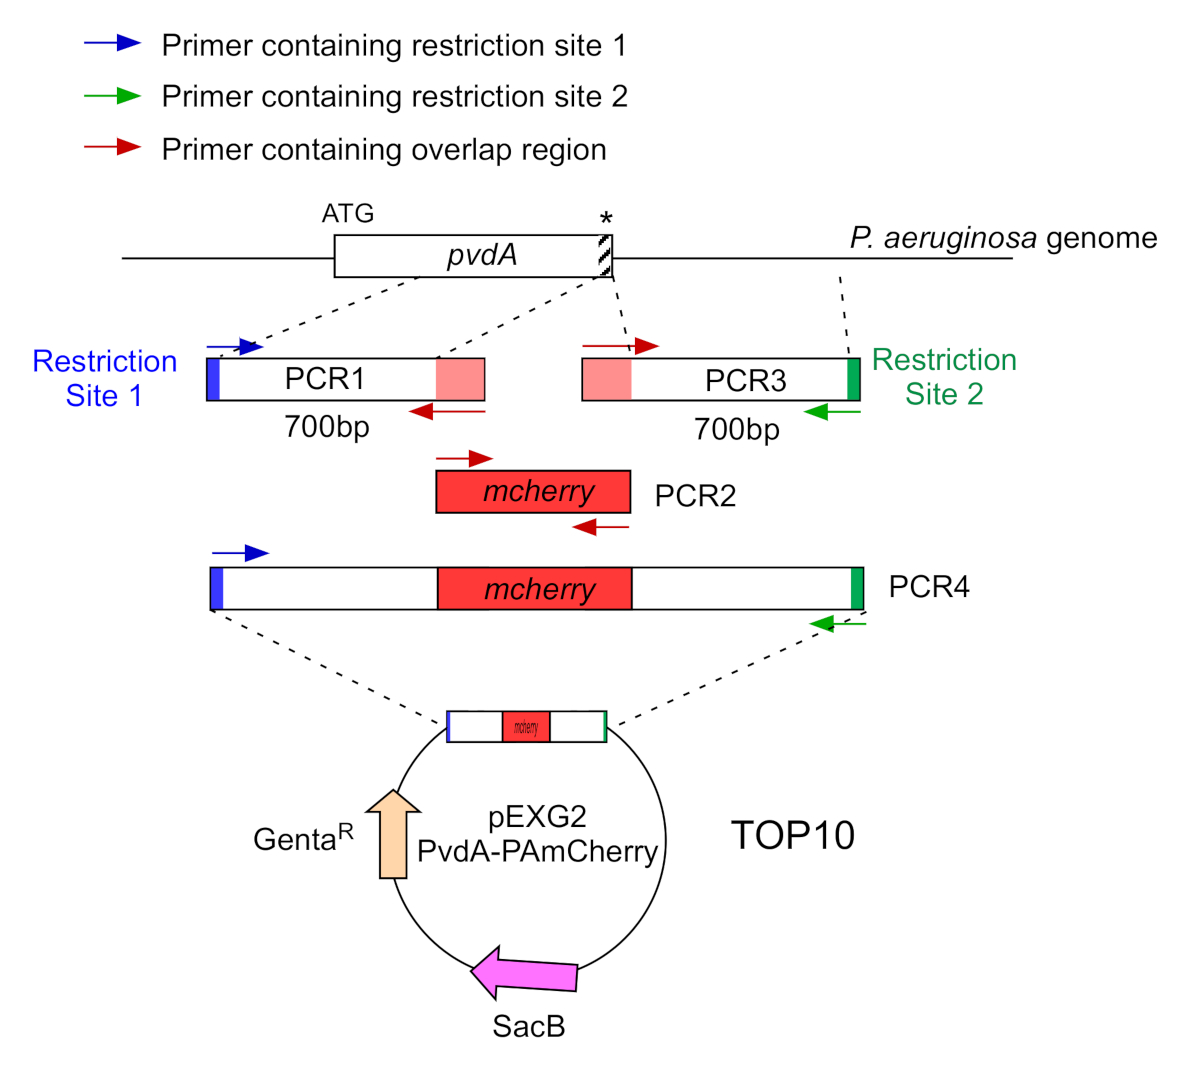
- Amplify by two PCR (PCR1 and 3) the DNA sequences (use genomic DNA of P. aeruginosa PAO1) of the 700 base pairs upstream and downstream of the regions corresponding to the insertion site in P. aeruginosa genome with high-fidelity DNA polymerase. Add restriction sites to primers in blue and green and add an overlapping sequence with mCherry to primers in red (Figure 2).
- For PvdA labelled at the C-terminus with eGFP, amplify the 700 bp region upstream relative to the stop codon by the primers in blue, and amplify the 700 bp downstream region containing the stop codon with the primers in green.
- For PvdL labelled at the N-terminus with mCherry, amplify the 700 bp region upstream to the PvdL gene, including the start codon, by the primers in blue, and amplify the 700 bp downstream region with the primers in green.

Figure 2: Overview of PCR strategy and plasmids construction used for the construction of PvdA-mCherry. See text for details - pvdA encodes an enzyme involved in the biosynthesis of the siderophore pyoverdine, a secondary metabolite involved in iron acquisition. Please click here to view a larger version of this figure.
- Amplify the eGFP encoding DNA (without the start and stop codons) with primers in red with High-Fidelity DNA polymerase.
- Purify the PCR products on a PCR clean up column (Table of Materials).
- Mix overlapping PCR products in equimolar ratio and perform a second PCR using primers with restriction site used for PCR 1 and 3 (green and blue in Figure 2).
- Migrate the PCR product in agarose-1x TAE (Tris-Base Acetate EDTA pH 8.0) gel, cut the corresponding band and extract the amplicon with a PCR clean up kit (Table of Materials).
NOTE: The protocol can be paused here. - Digest PCR amplicon and pEXG2 plasmid using the corresponding restriction enzymes21.
- Ligate plasmid and insert with T4 DNA ligase using 90 ng of plasmid and molecular ratio 1:1 (plasmid:insert).
- Transform plasmids construction in chemically competent cells E. coli TOP10 cells by mixing ligation product and 100 µL of TOP10. Incubate the competent bacteria/plasmid mixture on ice for 30 min before proceeding with a 42 °C heat shock for 60 s. Then, put the tube on ice for 10 min.
- Add 1 mL of lysogeny broth (LB) to the bacteria and incubate at 37 °C for 1 h.
- Plate 100 µL bacteria on LB agar containing 15 µg/mL gentamicin.
- Incubate overnight at 37 °C.
- Screen the presence of the insert by colony PCR: from one isolated transformant colony, pick up a minute amount of bacteria to be added to a PCR mix containing primers hybridizing on the plasmid in such a way that the presence of the amplicon could be detected by running the product on an agarose gel (DNA polymerase). From the same colony used for PCR, transfer a small amount of bacteria on a fresh plate containing 15 µg/mL gentamicin to be isolated and used for plasmid extraction. Finally, isolate and purify the plasmid (Table of Materials) and verify the insert by sequencing.
- Store TOP10 bacteria containing the plasmid in LB with 20 % glycerol in 1.5 mL microtube at -80 °C and the purified plasmid at -20 °C in 1.5 mL tube.
NOTE: The protocol can be paused here
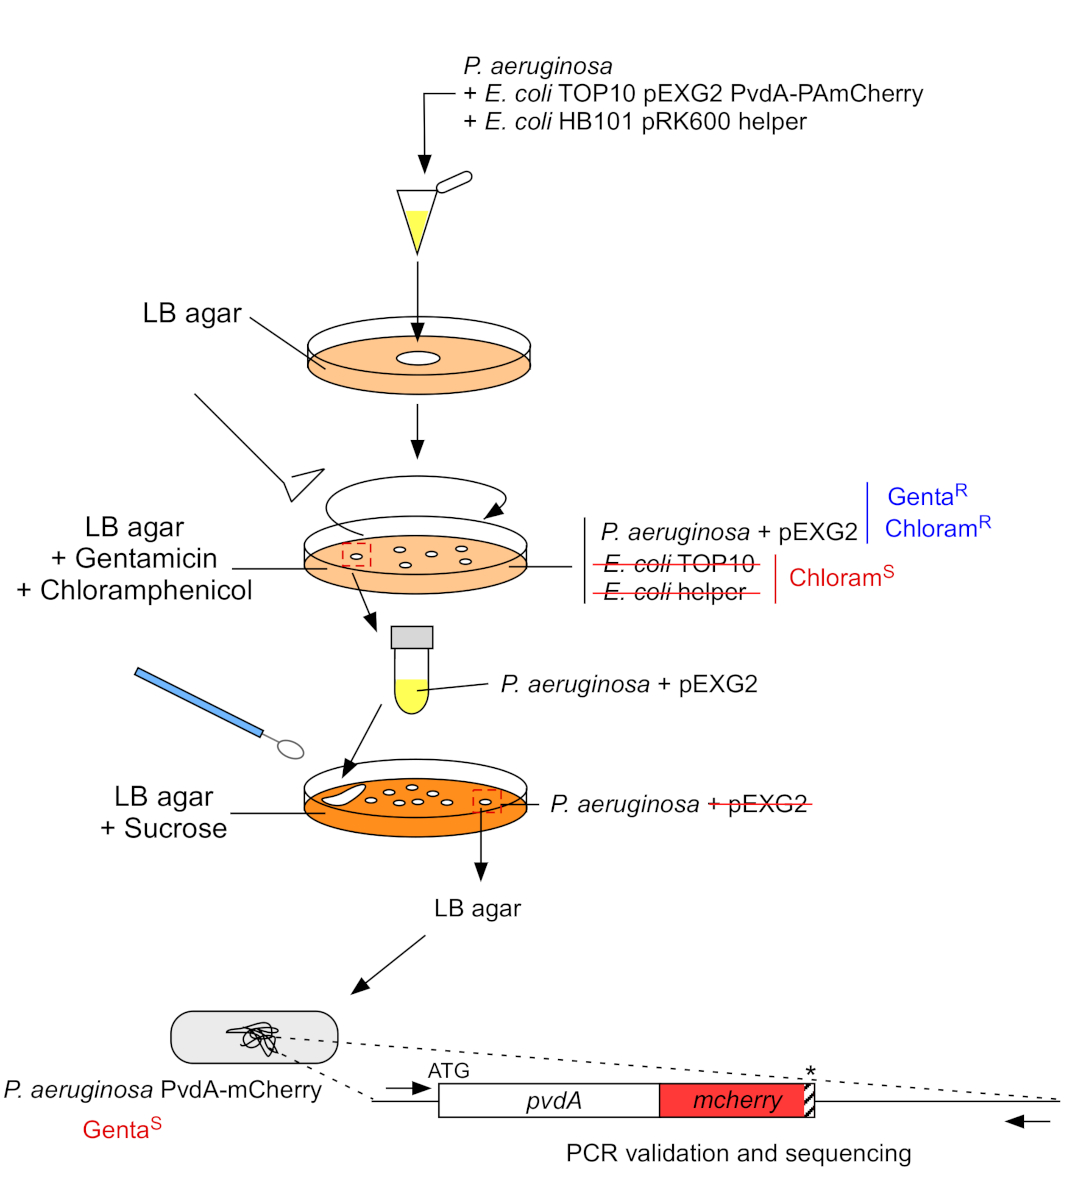
2. Fluorescent tag insertion into the chromosomal genome of P. aeruginosa (Figure 3)
- Grow P. aeruginosa, TOP10 and E. coli helper bacteria, each one in 5 mL of LB without antibiotic at 30 °C under orbital shaking overnight22. Generate fluorescent tag insertion in the genome of P. aeruginosa by transferring the plasmid from E. coli TOP10 into the PAO1 strain and integrating the plasmid into the genome by homologous recombination. A second crossing-over event excising the vector generate the corresponding mutant.
- Measure the optical density at 600 nm (OD600 nm) of the bacterial culture and mix an equal quantity of P. aeruginosa (500 µL, OD600 nm = 1.0) with E. coli TOP10 pEXG2 (500 µL, OD600 nm = 1.0) and E. coli HB101 pRK600 helper (500 µL, OD600 nm = 1.0) in 1.5 mL microtube.
- Centrifuge 5 min at 9,300 x g to pellet the bacteria.
NOTE: Online tools can be used to convert centrifugal g-force to rotation per minute (rpm) to adjust the centrifuge speed. - Keep the bacterial pellet and discard the supernatant.
- Resuspend the pellet containing bacteria in 50 µL of LB.
- Plate a spot (~50 µL) of the mixture on the middle of LB agar (preheat at 37 °C) and incubate 5 h at 37 °C.
- Scrap the spot with a sterile inoculation loop and resuspend in 1 mL of LB.
- Plate 100 µL of this bacterial suspension on LB agar containing 10 µg/mL chloramphenicol to eliminate E. coli (E. coli TOP10 pEXG2 and E. coli HB101 pRK600 helper are sensitive to chloramphenicol but P. aeruginosa is naturally resistant) and 30 µg/mL gentamicin and incubate 2 days at 37 °C.
- Resuspend one colony in 1 mL LB and incubate at 37 °C under orbital shaking 4h.
- Centrifuge 3 min at 9,300 x g and discard 950 µL of supernatant. Resuspend the pellet in 50 µL of LB and isolate the mixture on LB agar containing sucrose and without NaCl.
- Incubate overnight at 30 °C.
- Spot isolated colonies on LB agar and LB agar containing 15 mg/mL gentamicin in order to check the gentamicin sensitivity.
- Verify the eGFP or mCherry insertion by PCR colonies (DNA polymerase) and sequencing using specific primers.

Figure 3: Protocol of construction of P. aeruginosa strains by fluorescent tag insertion. See text for details. Please click here to view a larger version of this figure.
3. Pyoverdine measurement
- Grow bacteria in 5 mL of LB at 30 °C under orbital shaking overnight.
- Pellet bacteria by centrifugation, wash and grow them in 5 mL of SM (Succinate Medium, composition: 6 g∙L−1 K2HPO4, 3 g∙L−1 KH2PO4, 1 g∙L−1 (NH4)2 SO4, 0.2 g∙L−1 MgSO4, 7 H2O and 4 g∙L−1 sodium succinate with the pH adjusted to 7.0 by adding NaOH) at 30 °C under orbital shaking overnight. SM is an iron-deprived medium - the absence of iron will activate the expression of the proteins of the pyoverdine pathway normally repressed in the presence of iron.
- Measure OD600 nm and dilute bacteria again in fresh SM medium at OD600 nm = 0.1 and grow them at 30 °C under orbital shaking overnight.
- Measure OD600 nm to determine the quantity of bacteria in each sample.
- Prepare a quartz cuvette containing 100 µL of P. aeruginosa culture and complete to 1 mL of SM (900 µL). Prepare a quartz cuvette containing 1 mL of SM medium (blank).
- Using a UV-visible spectrophotometer, measure the absorbance at the maximum of the absorption peak. At pH 7.0, the maximum of absorption of pyoverdine will occur at ~400 nm. Determine the pyoverdine (apo form) concentration in sample using the Beer-Lambert law using a molar extinction coefficient at 400 nm of e = 19 000 M-1∙cm-1.
NOTE: Pyoverdine can be quantified in the range of absorbance from ~0.1 to ~1 (depending on UV-Visible spectrophotometer) in which the absorbance linearly increases with concentration.
4. Bacteria culture and conditions for cells to express PvdA, PvdL and PvdJ
- On day 1, inoculate a tube with 5 mL of LB from the appropriate glycerol stock of bacteria and grow bacteria over night at 30 °C at 200 rpm in an orbital shaker incubator.
- On day 2, pellet cells by centrifugation at 3,000 x g for 3 min and discard the supernatant.
- Resuspend the cells in 10 mL of SM.
- Repeat steps 4.2-4.3 once and grow bacteria in SM overnight at 30 °C 200 rpm.
- On day 3, dilute 1/10 the bacteria culture in fresh SM.
- Grow diluted bacteria again overnight at the same conditions.
NOTE: The presence of pyoverdine can be detected visually as it colors in yellow-green the growing media. It shows that the expression of the proteins of the pyoverdine pathway have been activated and that enzymes of interest are being expressed in the cells.
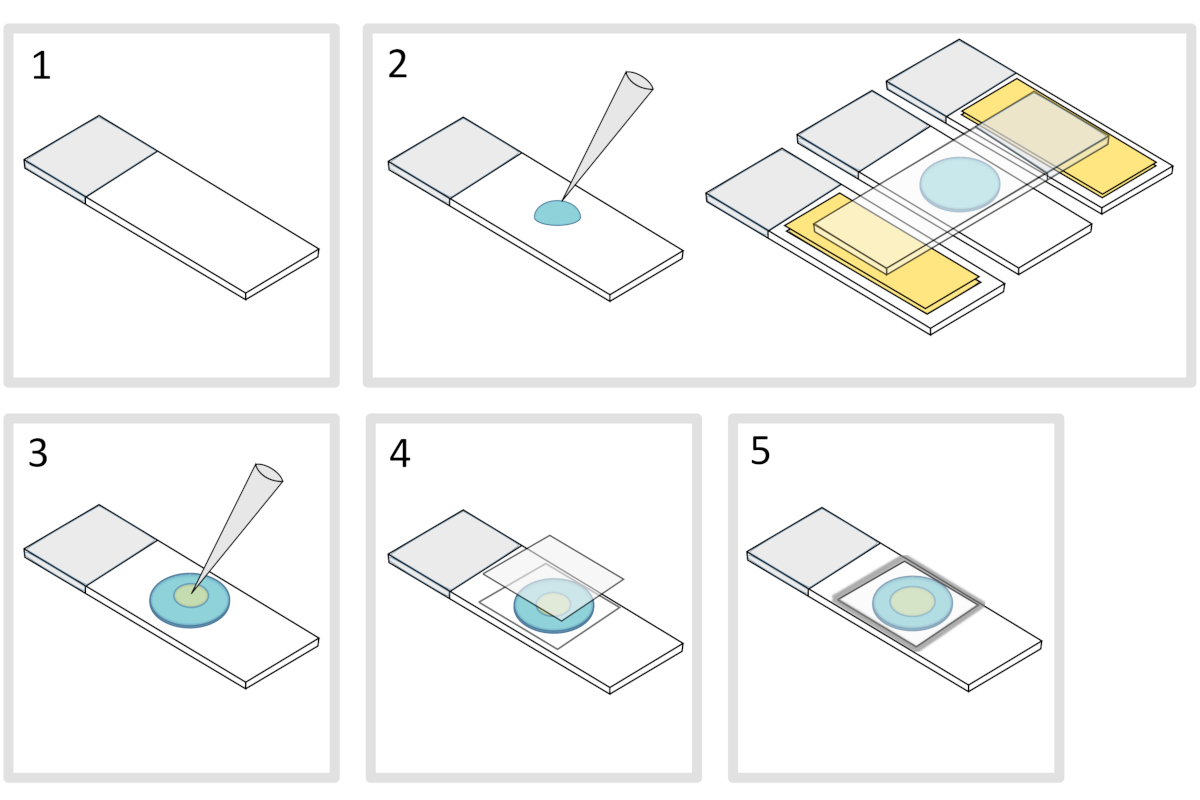
5. Preparation of agarose pad (Figure 4)
- Place a microscope glass-slide on a flat horizontal surface. Arrange two glass-slides topped with two layers of adhesive tape on each side of the initial slide.
NOTE: Keep a 1-2 mm space between the three aligned slides to prevent the meleted agarose to eventually spread on the slides with adhesive tape. - Pipette and pour a droplet of 70 µL of 1% melted agarose on the glass-slide. Add a fourth slide on the top to flatten the agarose droplet and press down gently. Wait about a minute.
- Take off the upper slide and drop with a pipette about 3 µL of bacteria into 3 to 4 spots at different locations onto the agarose pad.
- Cover with a microscopy glass coverslip (for example a 22x22 mm #1.5 thickness).
NOTE: Flatness and thickness of the coverslips are important for working with two-photon excitations. Precision coverslips with controlled uniform flatness and low autofluorescence are usually a good choice. - Fix the coverslip with melted paraffin to seal the coverslip onto the glass slide. Start by fixing the four corners of the coverslip.

Figure 4: Agarose pad preparation. Please click here to view a larger version of this figure.
6. Imaging with a two-photon microscopy setup
NOTE: We are using a home-made two-photon excitation scanning inverted microscope with a 60x 1.2NA water immersion objective operating in de-scanned fluorescence collection mode. Two-photon excitation wavelength is set at 930 nm. It is provided by a Ti:Sapphire laser (80 MHz repetition rate, ≈ 70 fs pulse width) working at 10-20 mW. Fluorescence photons were collected through a 680 nm short pass filter and a 525/50 nm band-pass filter before being directed to a fiber-coupled avalanche photo-diode connected to a time-correlated single photon counting (TCSPC) module. The microscope is also equipped with a transmission fluorescence lamp. Several FLIM-FRET microscopes are now commercially available and many imaging facilities are equipped with setups able to perform FLIM-FRET measurements.
- Use the fluorescence lamp to focus the objective on the monolayer of bacteria in the sample and select regions of interest.
- Check that the excitation laser shutter is closed and that the infrared light coming from the laser is blocked and do not enter the microscope.
Caution: Careful attention and constant vigilance should be given working with IR pulsed lasers as the laser light cannot be seen by eyes but any and even transient direct exposition or laser reflection can be extremely harmful and create irreversible eye damages. Please refer to the local laser safety procedures and training before using microscopy setups. - Place the microscopy slide on the stage with the coverslips facing the objective.
- Check that the fluorescence lamp is ON.
- Turn the filter cube turret to select the eGFP cube and open the fluorescence lamp shutter.
- Send the fluorescence light towards the eyepiece of the microscope.
Caution: Ensure appropriate filters are disposed in the light path to discard direct excitation light coming from the fluorescence lamp that can damage eyes. - Focus the objective on bacteria using the microscope knob.
- Select a region of interest in the sample by translating it using the joystick controlling the motorized stage
NOTE: Focusing is easier with highly fluorescent sample allowing the fluorescence to be seen directly with eyes. - Switch the excitation for the 2PE laser for FLIM-FRET measurements.
- Send the fluorescence emission path back towards the detector.
- Turn back the filter cube turret to select for the dichroic cube for the 930 nm laser.
- Set the laser power to 20 mW.
- Set the size of the region of interest to 30 µm. This operation adjusts the voltage operating the galvo-mirrors and defines the range of their movements (Figure 5).
- Turn on detector and start scanning the sample - the start and stop buttons controlling the scanning also control the opening and closing of the laser shutter both for safety reasons and to limit the photobleaching of the sample (Figure 5).

Figure 5: Schematic representation of the interface of microscope control software. Please click here to view a larger version of this figure.
- If necessary, adjust the focus by slightly moving the microscope fine focus knob.
- Choose the field of view for imaging by moving finely the stage from the computer interface. This can be done on the setup by moving the cross on the image in the microscope control software (Figure 5) that will define the new center of the image and pressing Move Stage. A good field of view for acquisition corresponds to an image with 10-30 immobile bacteria, all correctly focused (all bacteria are on the same plane). If interested in extracting single cells FLIM-FRET data, ensure that bacteria are well individualized (image segmentation will be much easier).
- Open the SPCM software (commercial software for data acquisition) and check that the photons count rate is not too high to avoid pile-up effect that can affect lifetime measurements. If necessary, lower down the laser intensity to keep the photon count rate low (around 1% of the laser repetition rate).
NOTE: Pile-Up effect describes the effects of photons lost at high photon count rates due to the dead time of the Time Correlated Single Photon Counting (TCSPC) devices. If Pile-Up occurs, the measured average lifetime becomes artificially shorter with possibly an additional shorter component that can appear in the decay due to the oversampling the fast-emitting photons. - Adjust acquisition parameters including the acquisition collection time (typically 60 s to 180 s are required to collect enough photons).
- Press the Start button and wait for the acquisition to complete.
- Save the data.
- Stop scanning the sample and turn off the detector.
- Select another field of view in sample and repeat steps 6.14-6.22 or image a new microscopy slide by repeating steps 6.1-6.22.
NOTE: P. aeruginosa can live and divide for up to 6-8 hours at room temperature on the agarose pad (corresponding to at last ~4 doubling time at 20°C). Ideally, do not wait too long to perform FLIM-FRET measurement to avoid observing a pad completely covered with bacteria.
7. Data analysis

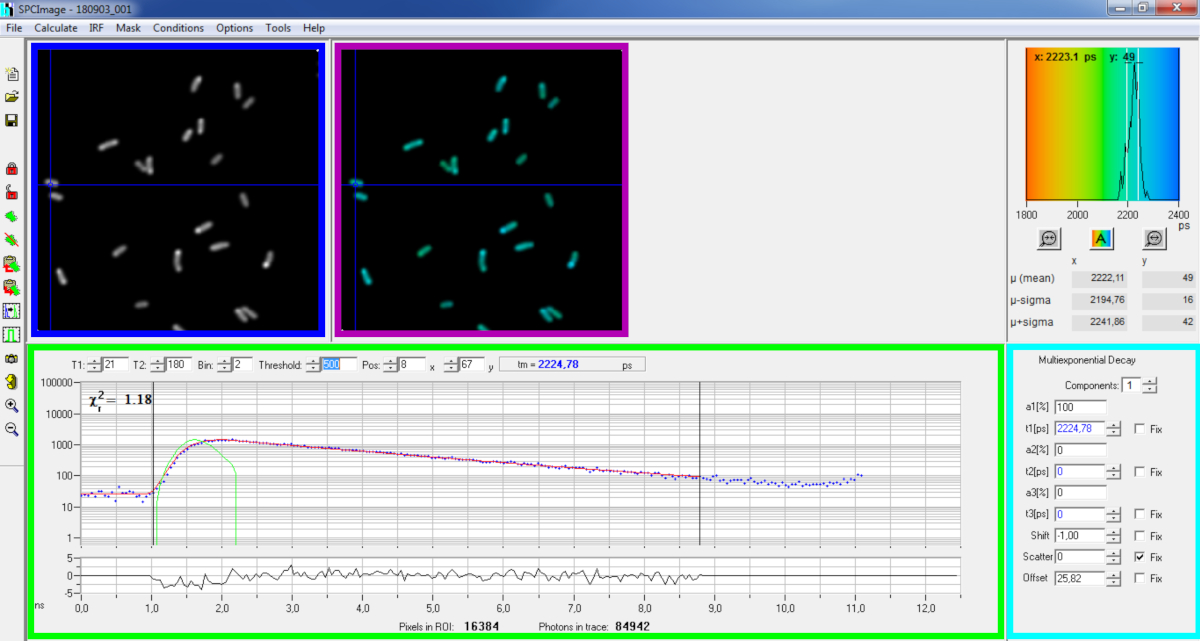
Figure 6: Main panel of the data analysis window of SPCImage software. Intensity image (blue box), lifetime image (purple box), lifetime histogram (upper right), decay curve at selected position (green box), and decay parameters at selected position (cyan box) of a representative PvdA-eGFP decay recorded in live P. aeruginosa using a bh SPC830 acquisition card on a home-made Two-Photon Excitation-FLIM-FRET setup. The experimental decay curve of the pixel pointed in the above image, its mono-exponential fit (red curve) deconvoluting the decay from its calculated instrumental response function (green curve) can be seen in the green panel. Please click here to view a larger version of this figure.
- Basic analysis
- Run the SPCImage software.
- Import the saved SPCM file. The intensity image is displayed on the left upper panel of the software (Figure 6 blue box).
- Examine the decay curve window (Figure 6 green box) which displays the decay data corresponding to the pixel selected in the intensity image (Figure 6 blue box). The photon numbers of each time channel are shown as blue dots and the fit of the decay is drawn as a red line. Note that after loading the data the software displays the brightest pixel of the image. Move the blue cross across the image to examine pixels with lower intensity. The decay window will automatically refresh at each new pixel position.
NOTE: Measuring the Instrumental Response Function (IRF) of a laser scanning system is very difficult. An IRF calculated from the rising edge of the fluorescence decay curves in the FLIM data can be used for decay deconvolution. This is the option done by default in SPCimage (Figure 6 green curve). - Adjust the fitting range by moving the starting and ending channels of the fitting box (T1 and T2 in the green box). T1 should start at the first few channels of the rising decay and T2 define the last channel at the end of the decay and can be chosen as one of the last channels of the decay with a number of photons above the photons count offset (i.e., the levels of photons counted before the decay rises).
- Choose the binning by changing the Bin value. The curve decay integrates the photon counting of the selected pixel together with an area of i pixels around the cursor position defined by the bin parameter (increasing the binning will increase the number of photons in the decay and may be helpful to reach the photon counts required for multi-exponential models).
- Adjust the Threshold value. Pixels that do not have at least one channel with a number of photons higher than the threshold value will not be included in the fitting procedure. Of course the higher the number of pixels to fit, the longer the analysis.
NOTE: FLIM data can contain an enormous number of pixels and time channels. The last versions of the software allow using GPU (Graphics Processor Unit) to process a large number of pixels in parallel, which massively reduces processing times. It can be interesting to adjust the binning and threshold parameters using images corresponding to bacteria constructions exhibiting the lowest fluorescence intensity (e.g., with bacterial strains with the lowest expression levels). This will ensure that the relevant decays observed in these samples will meet the filtering criteria and will be included in the analysis. These parameters can then be used for all images. - Adjust, if necessary, the decay parameters (cyan box). Let the shift vary, most of the time scatter and offset can be fixed to zero if a look at the decay functions show that their contribution is negligible. The offset can be estimated looking at the first channels of the decay - note that imaging for a long time due to low fluorescence in the sample usually results in non-zero offset. Scattering occurs mostly in thick samples and can be considered negligible otherwise.
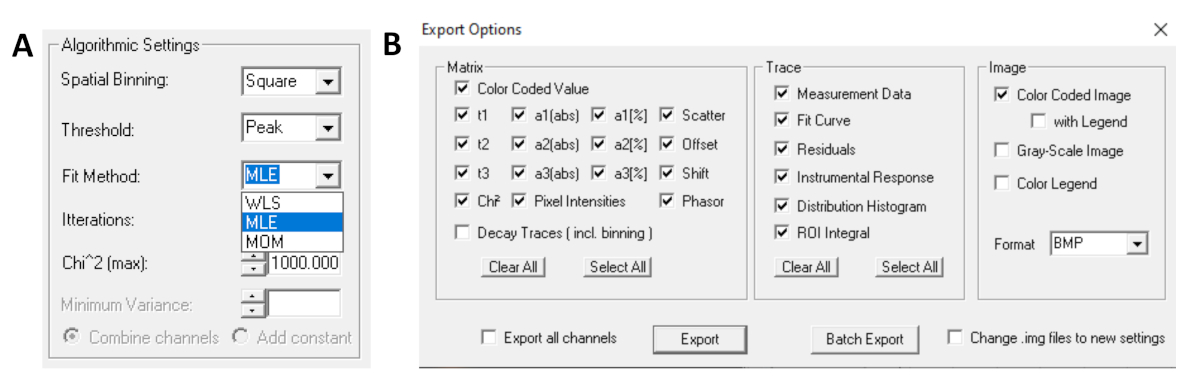
- Before running the fit, select the fitting algorithm. Open the algorithm settings window in Show/Hide Model Options. Select maximum likelihood estimation (MLE) algorithm (Figure 7A).
- Run the fitting of the image by clicking Calculate | Decay matrix. Once completed, the lifetime encoded FLIM image appears in the lifetime image panel (Figure 6 purple box).
NOTE: On the decay curve window (Figure 6 green box) it is possible to see the lifetime value that corresponds to each pixel of the image by moving the blue cross.
NOTE: to process a large number of similar FLIM data files automatically, a batch processing mode can be used. - Check the quality of the fit looking at the residuals (ideally distributed randomly around 0) and a Chi square value close to 1.
- Fitted data can be exported in different formats. To export files in txt files, go to File | Export. In the Export options window (Figure 7B), choose Select All and then click Export.
- Finally save the analysis file. Analysis files are saved as *.img files and can be reopened directly in SPCImage.
NOTE: In particular cases of unbalanced donor/acceptor quantities, FLIM-FRET can reveal sub-populations in a mixture of interacting protein complexes - in particular when the concentrations of the two partners are very different, thus resulting in mixtures of complex and free species. Non-interacting species (characterized by a decay very similar to the donor only decay) can be discriminated from interacting ones assuming a spatial invariance of the donor lifetime components across the data set. Similarly, non-stoichiometric interacting complexes with either more donors or more acceptor of fluorescence may form. The fluorescence decays of such complexes are usually difficult to interpret. A FLIM diagram plot can be used to provide critical information about stoichiometry and binding mode of PPIs20,23. The FLIM diagram plot is a graphical representation of the shortest lifetime component as a function of its amplitude. It can be used to visualize pixels with similar decay signatures. To draw such representations, experimental fluorescence decays have to be fitted with a two exponential model. The following steps can be a guide through this process. - Start by analyzing the data of the donor only construction. It will allow determining the lifetime value of the donor. Ideally, measure this value over several images recorded in the same conditions as the donor/acceptor constructions to retrieve a robust lifetime value for the donor.
- Once determined, fit the fluorescence decays of donor/acceptor constructions with a two-exponential model. In the cyan decay parameter box (Figure 6), set the number of components to 2. Fix t2(ps) parameter to the robust lifetime value of the donor determined in step 1 and check the box to fix this parameter.
NOTE: It is important to fix the long-lived lifetime τ2 in order to limit over-fitting, to improve fitting convergence, and to obtain more reliable two-exponential fit parameters24,25,26. - Save the *img file and export data as *.asc files as in step 7.1.11.

Figure 7: (A) Algorithm settings for fitting the decays with exponential models. Selecting MLE (maximum-likelihood algorithm or maximum-likelihood estimation, MLE) as the fit model, and (B) export options window. Please click here to view a larger version of this figure.
- Advanced analysis of the FLIM images in R
- Install R (https://cran.r-project.org) and RStudio (https://rstudio.com) if necessary.
- Open RStudio and create a new project.
- Move all analysis *.asc file in a folder called “data” in the project main folder.
- Open a new script file (or open the supplementary script FLIM_analysis.R).
- Install the dedicated flimDiagRam package for flim data analysis https://github.com/jgodet/flimDiagRam. Call the package in the workspace. (See the notice HowTo_FlimDiagRam)
NOTE: Installation of packages have to be done only once. Once installed, packages can be called from any new R session. Downloading R packages from github requires installing ‘devtools’ package. The installation of ‘devtools’ can take several minutes. The flimDiagRam package can be used to represent the parameters and distributions of the FLIM data, to extract FLIM data at the level of single individualized cells, to compare FLIM results across conditions or strains and to explore FLIM data using advanced visualization tools like the FLIM diagram plot. - Use the step-by-step commented code and the data are made available to independently reproduce all the sub-figures presented in the Representative Results section below. This tutorial can be found in the notice HowTo_FlimDiagRam at https://github.com/jgodet/flimDiagRam/blob/master/HowTo.pdf. The code can be easily transposed to analyze the data.
Results
Empirical cumulative distribution functions (ecdf) of the fluorescence lifetimes measured for the different bacterial strains are shown in Figure 8. If FRET occurs, the ecdfs are shifted towards the shorter-lived lifetimes (Figure 8A,8B). Note that when the interaction of the two proteins results in a long distance between the two fluorophores, no FRET can occur (Figure 8C). This situation cannot be distinguished fr...
Discussion
FLIM-FRET offers some key advantages over intensity-based FRET imaging. Fluorescence lifetime is an intrinsic parameter of the fluorophore. As a consequence, it is not dependent on local concentrations of fluorophores neither on the intensity of the light excitation. The fluorescence lifetime is additionally also poorly affected by photo-bleaching. It is particularly interesting to evidence PPIs in cells where local proteins concentrations can be highly heterogeneous throughout the subcellular compartments or regions. FL...
Disclosures
The authors have nothing to disclose.
Acknowledgements
We acknowledge Dr Ludovic Richert for his valuable assistance on FLIM data acquisition and for the technical maintenance and development of the FLIM setup. This work was funded by grants from Fondation pour la Recherche en Chimie (https://icfrc.fr/). VN is funded by the Fondation pour la Recherche Médicale (FRM‐SPF201809006906). YM is grateful to the Institut Universitaire de France (IUF) for support and providing additional time to be dedicated to research. IJS and JG acknowledge the Institute on Drug Delivery of Strasbourg for its financial support.
Materials
| Name | Company | Catalog Number | Comments |
| 525/50 nm band-pass filter | F37-516, AHF, Germany | ||
| 680 nm short pass filter | F75-680, AHF, Germany | ||
| Agarose | Sigma-Aldrich | A9539 | |
| Ammonium Sulfate (NH4)2SO4 | Sigma-Aldrich | A4418 | |
| DreamTaq DNA polymerase 5U/μL | ThermoFisher Scientific | EP0714 | |
| E. coli TOP10 | Invitrogen | C404010 | |
| Fiber-coupled avalanche photo-diode | SPCM-AQR-14- FC, Perkin Elmer | ||
| Glass coverslips (Thickness No. 1.5, 20×20mm | Knitel glass | MS0011 | |
| High-Fidelity DNA polymerase Phusion 2U/μL | ThermoFisher Scientific | F530S | |
| Lysogeny broth (LB) | Millipore | 1.10285 | |
| Magnesium Sulfate Heptahydrate (MgSO4 . 7H2O) | Sigma-Aldrich | 10034-99-8 | |
| Microscope slides (25×75mm) | Knitel glass | MS0057 | |
| NucleoSpin Gel and PCR Clean-up | Macherey-Nagel | 740609.50 | |
| NucleoSpin Plasmid | Macherey-Nagel | 740588.10 | |
| Potassium Phosphate Dibasic (K2HPO4) | Sigma-Aldrich | RES20765 | |
| Potassium Phosphate Monobasic (KH2PO4) | Sigma-Aldrich | P5655 | |
| Sodium Succinate (Disodium) | Sigma-Aldrich | 14160 | |
| SPCImage, SPCM software | Becker & Hickl | ||
| Sterile inoculating loop | Nunc | 7648-1PAK | |
| T4 DNA ligase 1U/μL | ThermoFisher Scientific | 15224017 | |
| TCSPC module | SPC830, Becker & Hickl, Germany | ||
| Ti:Sapphire laser | Insight DeepSee, Spectra Physics | ||
| Tubes 50mL | Falcon | 352070 |
References
- Braun, P., Gingras, A. C. History of protein-protein interactions: From egg-white to complex networks. Proteomics. 12, 1478-1498 (2012).
- Nooren, I. M. A., Thornton, J. M. Structural characterisation and functional significance of transient protein-protein interactions. Journal of Molecular Biology. 325, 991-1018 (2003).
- Hayes, S., Malacrida, B., Kiely, M., Kiely, P. A. Studying protein-protein interactions: Progress, pitfalls and solutions. Biochemical Society Transactions. 44, 994-1004 (2016).
- Guillon, L., Altenburger, S., Graumann, P. L., Schalk, I. J. Deciphering protein dynamics of the siderophore pyoverdine pathway in Pseudomonas aeruginosa. PLoS ONE. 8, 1-9 (2013).
- Ringel, M. T., Brüser, T. The biosynthesis of pyoverdines. Microbial Cell. 5, 424-437 (2018).
- Schalk, I. J., Rigouin, C., Godet, J. An overview of siderophore biosynthesis among fluorescent Pseudomonads and new insights into their complex cellular organization. Environmental Microbiology. 22, 1447-1466 (2020).
- Cui, Y., et al. Techniques for detecting protein-protein interactions in living cells: principles, limitations, and recent progress. Science China Life Sciences. , (2019).
- Day, R. N., Mazumder, N., Sun, Y., Christopher, K. G. FRET microscopy: Basics, issues and advantages of FLIM-FRET imaging. Springer Series in Chemical Physics. 111, 249-276 (2015).
- Bastiaens, P. I. H., Squire, A. Fluorescence lifetime imaging microscopy: Spatial resolution of biochemical processes in the cell. Trends in Cell Biology. 9, 48-52 (1999).
- Yasuda, R. Imaging spatiotemporal dynamics of neuronal signaling using fluorescence resonance energy transfer and fluorescence lifetime imaging microscopy. Current Opinion in Neurobiology. 16, 551-561 (2006).
- Tramier, M., Zahid, M., Mevel, J. -. C., Masse, M. -. J., Coppey-Moisan, M. Sensitivity of CFP/YFP and GFP/mCherry Pairs to Donor Photobleaching on FRET Determination by Fluorescence Lifetime Imaging Microscopy in Living Cells. Microscopy Research and Technique. 71, 146-157 (2008).
- Bajar, B. T., Wang, E. S., Zhang, S., Lin, M. Z., Chu, J. A guide to fluorescent protein FRET pairs. Sensors (Switzerland). 16, 1-24 (2016).
- Piston, D. W., Kremers, G. J. Fluorescent protein FRET: the good, the bad and the ugly. Trends in Biochemical Sciences. 32, 407-414 (2007).
- Leray, A., et al. Optimized protocol of a frequency domain fluorescence lifetime imaging microscope for fret measurements. Microscopy Research and Technique. 72, 371-379 (2009).
- Elson, D. S., et al. Real-time time-domain fluorescence lifetime imaging including single-shot acquisition with a segmented optical image intensifier. New Journal of Physics. 6, 1-13 (2004).
- Rajoria, S., Zhao, L., Intes, X., Barroso, M. FLIM-FRET for Cancer Applications. Current Molecular Imaging. 3, 144-161 (2014).
- Drobizhev, M., Makarov, N. S., Tillo, S. E., Hughes, T. E., Rebane, A. Two-photon absorption properties of fluorescent proteins. Nature Methods. 8, 393-399 (2011).
- Visca, P., Ciervo, A., Orsi, N. Cloning and nucleotide sequence of the pvdA gene encoding the pyoverdin biosynthetic enzyme L-ornithine N5-oxygenase in Pseudomonas aeruginosa. Journal of Bacteriology. 176, 1128-1140 (1994).
- Imperi, F., Visca, P. Subcellular localization of the pyoverdine biogenesis machinery of Pseudomonas aeruginosa: A membrane-associated 'siderosome'. FEBS Letters. 587, 3387-3391 (2013).
- Gasser, V., et al. In cellulo FRET-FLIM and single molecule tracking reveal the supra-molecular organization of the pyoverdine bio-synthetic enzymes in Pseudomonas aeruginosa. Quarterly Reviews of Biophysics. , 1-11 (2019).
- Rietsch, A., Mekalanos, J. J. Metabolic regulation of type III secretion gene expression in Pseudomonas aeruginosa. Molecular Microbiology. 59, 807-820 (2006).
- Herrero, M., De Lorenzo, V., Timmis, K. N. Transposon vectors containing non-antibiotic resistance selection markers for cloning and stable chromosomal insertion of foreign genes in gram-negative bacteria. Journal of Bacteriology. 172, 6557-6567 (1990).
- Godet, J., Mély, Y. Exploring protein-protein interactions with large differences in protein expression levels using FLIM-FRET. Methods and Applications in Fluorescence. 8, 014007 (2019).
- El Meshri, S. E., et al. Role of the nucleocapsid domain in HIV-1 gag oligomerization and trafficking to the plasma membrane: A fluorescence lifetime imaging microscopy investigation. Journal of Molecular Biology. 427, 1480-1494 (2015).
- Becker, W. The bh TCSPC Handbook. Scanning. , 1 (2010).
- Richert, L., Didier, P., de Rocquigny, H., Mély, Y. Monitoring HIV-1 protein oligomerization by FLIM FRET microscopy. Springer Series in Chemical Physics. , 111 (2015).
- Fereidouni, F., Blab, G. A., Gerritsen, H. C. Phasor based analysis of FRET images recorded using spectrally resolved lifetime imaging. Methods and Applications in Fluorescence. 2, (2014).
- Fereidouni, F., Gorpas, D., Ma, D., Fatakdawala, H., Marcu, L. Rapid fluorescence lifetime estimation with modified phasor approach and Laguerre deconvolution: a comparative study. Methods and Applications in Fluorescence. 5, 035003 (2017).
- Margineanu, A., et al. Screening for protein-protein interactions using Förster resonance energy transfer (FRET) and fluorescence lifetime imaging microscopy (FLIM). Scientific Reports. 6, (2016).
- Guzmán, C., Oetken-Lindholm, C., Abankwa, D. Automated High-Throughput Fluorescence Lifetime Imaging Microscopy to Detect Protein-Protein Interactions. Journal of Laboratory Automation. 21, 238-245 (2016).
- Liu, W., Cui, Y., Ren, W., Irudayaraj, J. Epigenetic biomarker screening by FLIM-FRET for combination therapy in ER+ breast cancer. Clinical Epigenetics. 11, 1-9 (2019).
- Liu, X., et al. Fast fluorescence lifetime imaging techniques: A review on challenge and development. Journal of Innovative Optical Health Sciences. 12, 1-27 (2019).
- Padilla-Parra, S., Auduge, N., Coppey-Moisan, M., Tramier, M. Non fitting based FRET-FLIM analysis approaches applied to quantify protein-protein interactions in live cells. Biophysical Reviews. 3, 63-70 (2011).
- Padilla-Parra, S., Audugé, N., Coppey-Moisan, M., Tramier, M. Quantitative FRET analysis by fast acquisition time domain FLIM at high spatial resolution in living cells. Biophysical Journal. 95, 2976-2988 (2008).
- Stringari, C., et al. Phasor approach to fluorescence lifetime microscopy distinguishes different metabolic states of germ cells in a live tissue. Proceedings of the National Academy of Sciences of the United States of America. 108, 13582-13587 (2011).
- Digman, M. A., Caiolfa, V. R., Zamai, M., Gratton, E. The phasor approach to fluorescence lifetime imaging analysis. Biophysical Journal. 94, 14-16 (2008).
- Liang, Z., Lou, J., Scipioni, L., Gratton, E., Hinde, E. Quantifying nuclear wide chromatin compaction by phasor analysis of histone Förster resonance energy transfer (FRET) in frequency domain fluorescence lifetime imaging microscopy (FLIM) data. Data in Brief. 30, 105401 (2020).
- Grimm, J. B., Heckman, L. M., Lavis, L. D. The chemistry of small-molecule fluorogenic probes. Progress in Molecular Biology and Translational Science. 113, (2013).
- Li, L., Sun, H. Next Generation of Small-Molecule Fluorogenic Probes for Bioimaging. Biochemistry. 59, 216-217 (2020).
- Yao, R., Ochoa, M., Yan, P., Intes, X. Net-FLICS: fast quantitative wide-field fluorescence lifetime imaging with compressed sensing - deep learning approach. Light: Science and Applications. 8, 1-7 (2019).
- Smith, J. T., et al. Fast fit-free analysis of fluorescence lifetime imaging via deep learning. Proceedings of the National Academy of Sciences of the United States of America. 116, 24019-24030 (2019).
- Yao, R., Ochoa, M., Intes, X., Yan, P. Deep compressive macroscopic fluorescence lifetime imaging. Proceedings - International Symposium on Biomedical Imaging. 2018, 908-911 (2018).
Reprints and Permissions
Request permission to reuse the text or figures of this JoVE article
Request PermissionThis article has been published
Video Coming Soon
Copyright © 2025 MyJoVE Corporation. All rights reserved