
A subscription to JoVE is required to view this content. Sign in or start your free trial.
Method Article
Nanoparticle Tracking Analysis for the Quantification and Size Determination of Extracellular Vesicles
In This Article
Summary
We demonstrate how to use a novel nanoparticle tracking analysis instrument to estimate the size distribution and total particle concentration of extracellular vesicles isolated from mouse perigonadal adipose tissue and human plasma.
Abstract
The physiological and pathophysiological roles of extracellular vesicles (EVs) have become increasingly recognized, making the EV field a quickly evolving area of research. There are many different methods for EV isolation, each with distinct advantages and disadvantages that affect the downstream yield and purity of EVs. Thus, characterizing the EV prep isolated from a given source by a chosen method is important for interpretation of downstream results and comparison of results across laboratories. Various methods exist for determining the size and quantity of EVs, which can be altered by disease states or in response to external conditions. Nanoparticle tracking analysis (NTA) is one of the prominent technologies used for high-throughput analysis of individual EVs. Here, we present a detailed protocol for quantification and size determination of EVs isolated from mouse perigonadal adipose tissue and human plasma using a breakthrough technology for NTA representing major advances in the field. The results demonstrate that this method can deliver reproducible and valid total particle concentration and size distribution data for EVs isolated from different sources using different methods, as confirmed by transmission electron microscopy. The adaptation of this instrument for NTA will address the need for standardization in NTA methods to increase rigor and reproducibility in EV research.
Introduction
Extracellular vesicles (EVs) are small (0.03-2 µm) membrane-bound vesicles secreted by nearly all cell types1. They are often referred to as "exosomes," "microvesicles," or "apoptotic bodies" depending on their mechanism of release and size2. While it was initially thought that EVs were simply a means of eliminating waste from the cell to maintain homeostasis3, we now know that they can also participate in intercellular communication via transfer of molecular material - including DNA, RNA (mRNA, microRNA), lipids, and proteins4,5 - and that they are important regulators of normal physiology as well as pathological processes1,5,6,7,8.
There are many different methods to isolate and quantify EVs, which have been described elsewhere9,10,11,12. The isolation protocol used as well as the source of EVs can greatly impact EV yield and purity. Even differential centrifugation, long considered the "gold standard" approach for exosome isolation, can be subject to substantial variability subsequently impacting the EV population obtained and downstream analyses13. Thus, the various different methodologies for EV isolation and quantification make it difficult to compare, reproduce, and interpret results of experiments reported in the literature14. Furthermore, EV release can be regulated by cellular conditions or various external factors. It has been suggested that EVs play a role in maintaining cellular homeostasis by protecting cells against intracellular stress15, as several studies have shown that cellular stress stimulates EV secretion. For example, increased EV release has been reported after cellular exposure to hypoxia, endoplasmic reticulum stress, oxidative stress, mechanical stress, cigarette smoke extract, and particulate matter air pollution16,17,18,19,20,21,22. EV release has also been shown to be modified in vivo; mice subjected to a high fat diet or fasting for sixteen hours released more adipocyte EVs23. To investigate whether a specific treatment or condition alters EV release, the number of EVs must be accurately determined. Assessment of the EV size distribution may also indicate the predominant subcellular origin of EVs (e.g., fusion of late endosomes/multivesicular bodies with the plasma membrane vs. budding of the plasma membrane)24. Thus, there is a need for robust methods to accurately measure the total concentration and the size distribution of the EV prep being studied.
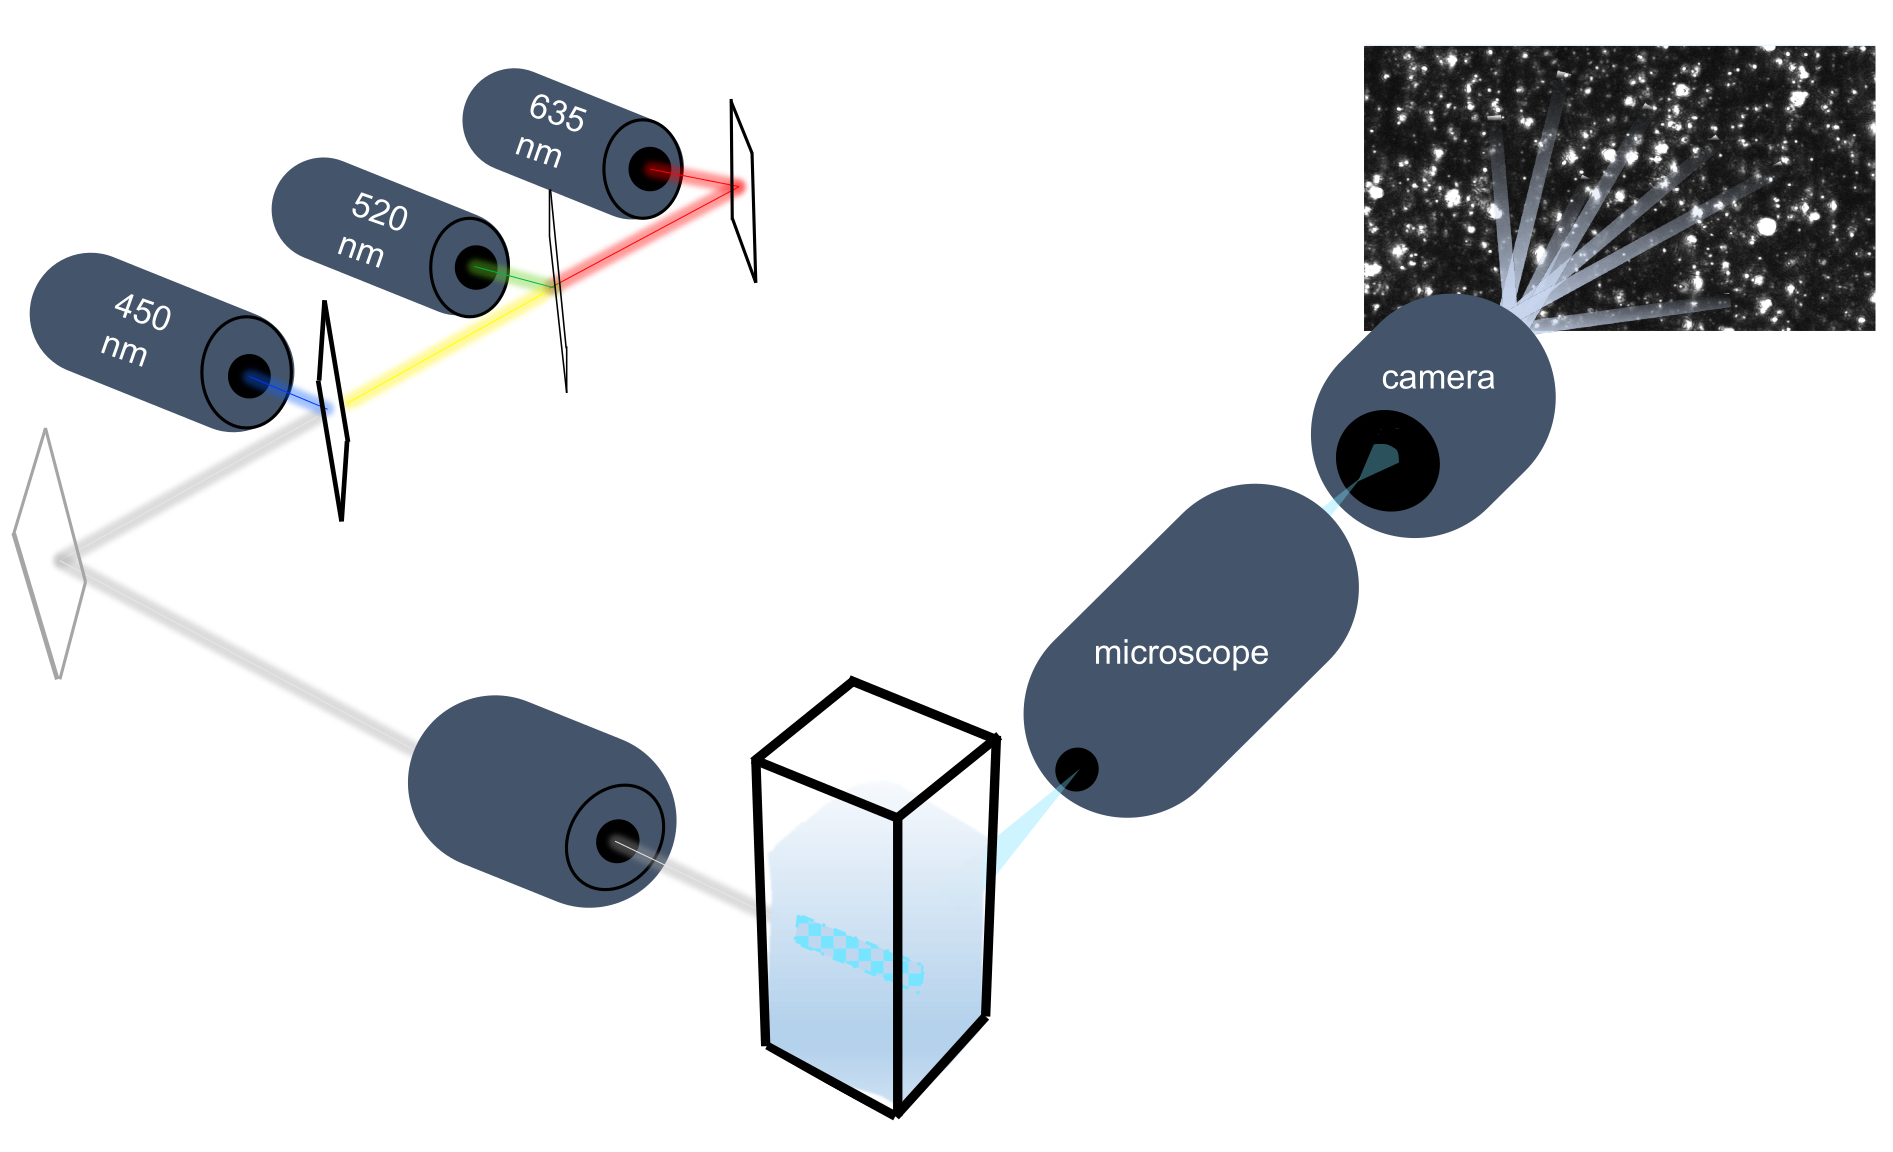
A rapid and highly sensitive method for the visualization and characterization of EVs in solution is nanoparticle tracking analysis (NTA). A detailed explanation of the principles of this method and comparison with alternative methods for assessment of EV size and concentration have been described previously25,26,27,28. Briefly, during NTA measurement, EVs are visualized by the light scattered when they are irradiated with a laser beam. The scattered light is focused by a microscope onto a camera which records the particle movement. The NTA software tracks the random thermal motion of each particle, known as Brownian motion, to determine the diffusion coefficient which is used to calculate the size of each particle using the Stokes-Einstein equation. NTA was first applied to measurement of EVs in a biological sample in 201125. Until recently, there were only two mainstream companies offering commercial NTA instruments29 until the introduction of the ViewSizer 3000 (hereafter referred to as the particle tracking instrument) which uses a combination of novel hardware and software solutions to overcome significant limitations of other NTA techniques.
The particle tracking instrument characterizes nanoparticles in liquid samples by analyzing their Brownian motion and characterizes larger micron-sized particles by analyzing gravitational settling. This instrument's unique optical system, which includes multispectral illumination with three laser light sources (at 450 nm, 520 nm, and 635 nm), allows researchers to analyze a wide range of particle sizes (e.g., exosomes, microvesicles) simultaneously. A schematic of the instrument setup is shown in Figure 1.
Here, we demonstrate how to perform particle size distribution and concentration measurements of isolated mouse and human EVs using a novel NTA instrument.

Figure 1: Particle tracking instrument optical system. The NTA instrument illuminates particles using three lasers with the following wavelengths: 450 nm, 520 nm, 635 nm. Video recording of the scattered light from individual particles is detected and tracked by a digital video camera oriented 90° from the cuvette. Please click here to view a larger version of this figure.
Protocol
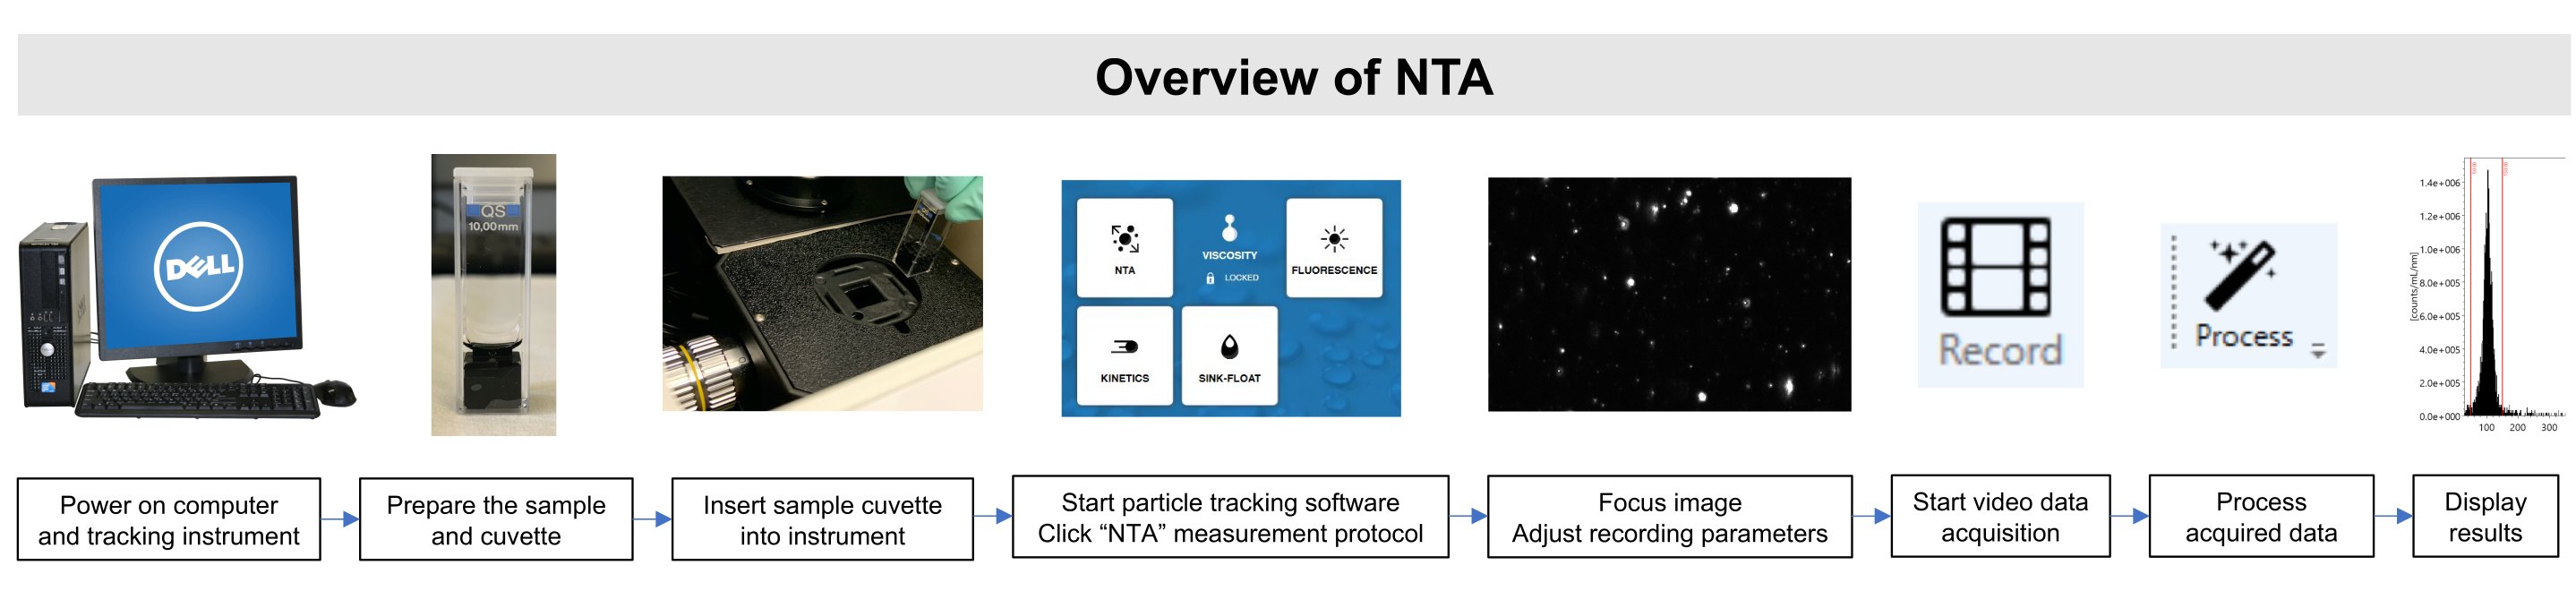
All work with these samples was performed in compliance with Institutional Animal Care and Use Committee and Institutional Review Board guidelines. A schematic overview of the NTA method is depicted in Figure 2.

Figure 2: Overview of NTA method using the particle tracking instrument. The sample is prepared and inserted into the instrument. The NTA software is opened, recording parameters are adjusted, and the sample is focused. Then, the data is recorded, processed, and displayed. Please click here to view a larger version of this figure.
1. Extracellular vesicle isolation
NOTE: Mouse perigonadal adipose tissue EVs were isolated as previously described23. Plasma EVs were isolated from 1 mL of human plasma using the following protocol:
- Collect the plasma and centrifuge at 3,000 x g for 15 min to remove cellular debris. Transfer the supernatant to a new tube.
NOTE: If additional debris remains detectable, centrifuge the supernatant for additional 10 min at 12,000 x g and transfer the supernatant to a new tube. - Add 67 µL of the exosome isolation reagent per 250 µL of plasma. Mix well by inverting or flicking the tube.
- Incubate on ice upright for 30 min.
- Centrifuge the exosome isolation reagent/plasma mixture at 3,000 x g for 10 min at 4 °C.
NOTE: Centrifugation may be performed at room temperature or 4 °C with similar results, but 4 °C is preferred. After centrifugation, the EVs may appear as a beige or white pellet at the bottom of the tube. - Carefully aspirate off the supernatant. Spin down any residual exosome isolation solution and remove all traces of fluid by aspiration, taking great care not to disturb the precipitated EVs in the pellet.
- Resuspend the pellet in 200 µL of Buffer B (provided by the manufacturer). Measure and record the sample's protein concentration (for step 2.8) using a spectrophotometer, fluorometer, Bradford assay, or other preferred method.
2. Purification of isolated EVs
- Add 200 µL of Buffer A (provided by the manufacturer) to re-suspended EVs.
- Take out the purification column (provided), loosen the screw cap, and snap off the bottom closure. Place the column into a collection tube.
NOTE: Save the bottom closure for steps 2.7-2.9. - Centrifuge at 1,000 x g for 30 s to remove the storage buffer.
- Discard the flow-through and place the column back into the collection tube.
- To wash the column, remove the cap and apply 500 µL of Buffer B on top of the resin and centrifuge at 1,000 x g for 30 s. Discard the flow through. Save the cap for steps 2.7-2.9.
- Repeat steps 2.4-2.5 one more time to wash the column.
- Plug the bottom of the column with the bottom closure (from step 2.2). Apply 100 µL of Buffer B on top of the resin to prepare it for sample loading.
- Add the entire content from step 1.6 (or up to volume equivalent of 4 mg of total protein) to the resin. Place the screw cap on the top of the column.
- Mix at room temperature on a rotating shaker for no more than 5 min.
3. Sample elution
- Loosen the screw cap and remove the bottom closure, and immediately transfer to a 2 mL microcentrifuge tube.
NOTE: The sample will start to elute as soon as the bottom closure is removed. Please make sure 2 mL microcentrifuge tubes are ready to receive eluate to minimize sample loss. - Centrifuge at 1,000 x g for 30 s to obtain purified EVs. Discard the column.
4. Sample preparation for nanoparticle tracking analysis
- Use a lint-free material like a microfiber cloth to cover the workspace and prevent fibers from entering cuvettes.
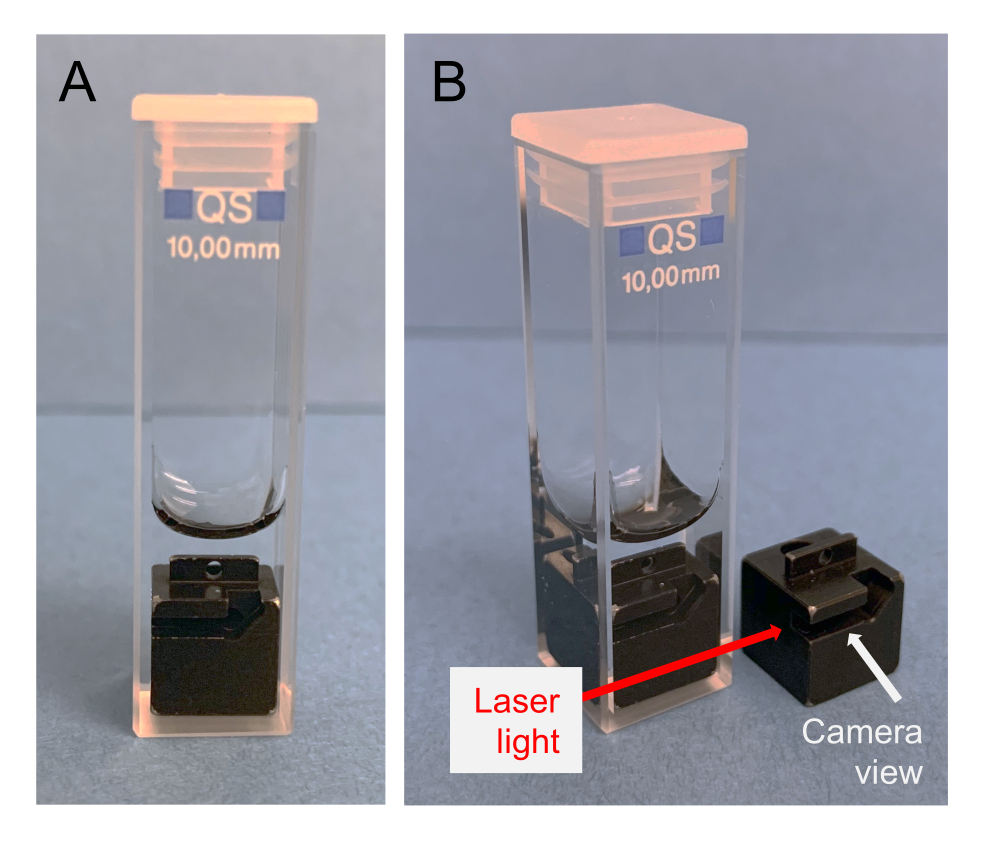
- Wearing gloves, place the cuvette onto the magnetic cuvette jig, then place the stir bar in the cuvette. Always handle the cuvettes with gloves to prevent fingerprints and smudges from appearing on the cuvette's surface.
- Use the hook tool to place the insert into the cuvette as depicted in Figure 3. It is important to note the orientation of the insert for later (Step 5.4).

Figure 3: Proper orientation of insert within the quartz cuvette. The "notch" of the insert should be visible from the front of the cuvette. This should be inserted into the instrument facing the camera. Please click here to view a larger version of this figure.
- Using a pipette, slowly add 400-500 µL of the diluent or diluted sample at room temperature to the cuvette through the hole in the insert. Gently pipette up and down to mix. Avoid introducing air bubbles.
- First prepare a cuvette loaded with the chosen diluent (blank) to measure the particle concentration of the diluent. This should be done before measuring the sample so that the background concentration of the sample can be corrected.
NOTE: A good blank (phosphate buffered saline [PBS] in this case) will have a concentration <9 x 10⁶ (depending on the diluent) and will display 1-10 particles per screen in the live view (Figure 4). It is recommended that the actual sample particle concentration is at least 3 times the background concentration. - Optionally, before recording the sample prime the cuvette with 400-500 µL of the diluent or diluted sample before measuring. To do so, load 400-500 µL of the diluted sample into the cuvette, discard the solution, and then add 400-500 µL more of the sample for the measurement. This may help with washing out residues within the cuvette.
- First prepare a cuvette loaded with the chosen diluent (blank) to measure the particle concentration of the diluent. This should be done before measuring the sample so that the background concentration of the sample can be corrected.

Figure 4: Representative live stream view of a diluent within the proper concentration range of a blank. Dilute EV preps in filtered (0.02 µm or 3 kDa, preferred) PBS. A good blank will display ~1-10 particles per screen in the live view, yielding a concentration within the range 105-106. Please click here to view a larger version of this figure.
- Cap the cuvette and check for bubbles. Tap out bubbles if necessary. Use a lint free cloth to wipe the outside faces of the cuvette.
5. Startup procedure of the particle tracking instrument
- Turn on the computer workstation and instrument, wait a few minutes prior to running the first sample and start the program by clicking on the software icon. When prompted, click NTA on the screen to conduct Nanoparticle Tracking Analysis. Begin in the Recording tab and click on the various software tabs (Record, Process, Plot) to switch between them throughout the protocol. Record the sample (diluent or EV prep) first, then process the recordings, and finally plot the results.
- Follow the instructions on the screen to fill out all the necessary information about the sample. Check that all necessary fields are completed and accurate, i.e., Sample name, Description, Sample preparation, Dilution factor [1000], Target temperature (Set to 22 °C), and Diluent: Select diluent from the dropdown menu and use PBS as the diluent for EVs. Selecting PBS from the dropdown menu will auto-populate the salinity to 9%. This information is necessary to determine the dynamic viscosity of the liquid.
NOTE: It can take up to 3 min for the temperature to equilibrate inside the cuvette even if the probe already shows desired temperature (i.e., green dot becomes stable). Sample readouts could vary considerably if target temperature is not set, as sample temperature differences could greatly alter the Brownian motion of particles. - Open the instrument lid and remove the protective cap covering where the cuvette will be placed.
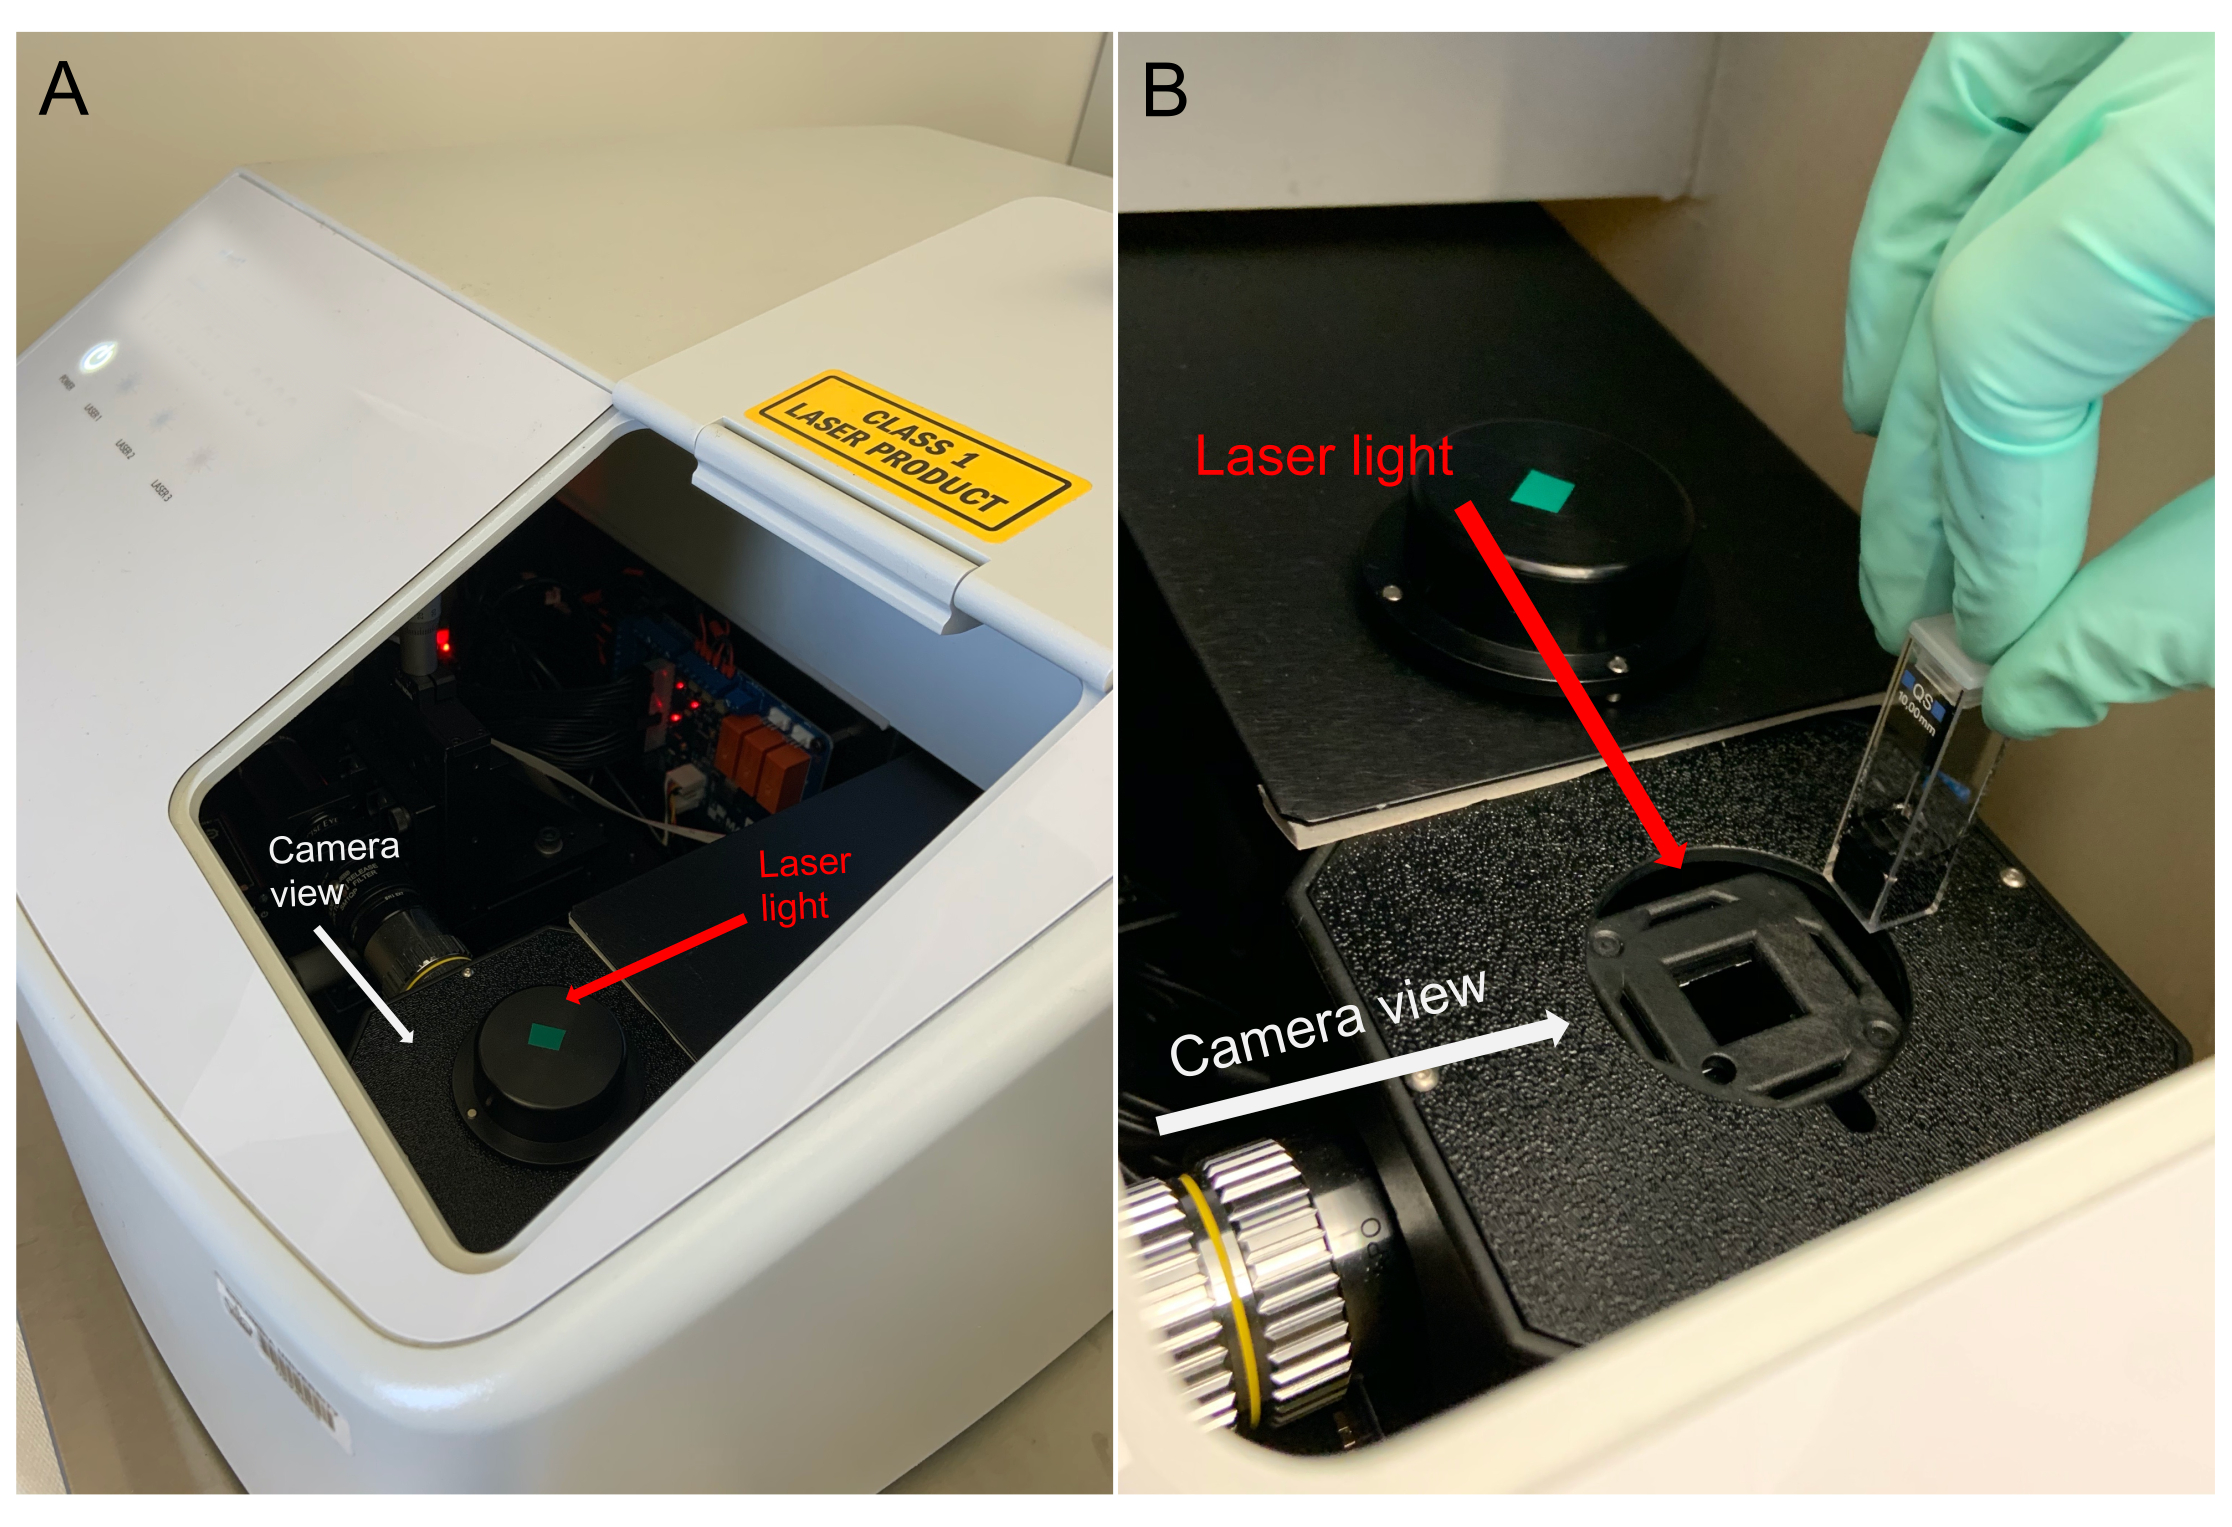
CAUTION: The particle tracking instrument is certified as a Class 1 laser product (21 CFR Ch. I part 1040), containing lasers that can be dangerous and could cause serious injury such as burns and/or permanent damage to eyesight. To prevent accident or injury, do not remove the instrument cover by unscrewing the bolts from the side. Note that during operation, the laser beams are completely enclosed, posing no threat to users. Also, a magnetic safety interlock is built into the instrument's sample holder to prevent the lasers from operating when the cap of the sample holder is removed. - Place the cuvette (from Step 4.3) inside the instrument in the correct orientation (see Figure 5). Replace the cap over the cuvette and close the instrument lid. Always operate the instrument with the cap in place over the sample holder. Do not disable or attempt to circumvent the safety interlock feature.

Figure 5: Proper orientation of cuvette within particle tracking instrument. The face of the cuvette (with the "notch" of the insert visible) should face the camera. Please click here to view a larger version of this figure.
- Turn on the camera by clicking the arrow above Streaming.
- Click the chevron arrow to expand the Record settings. Set Gain and Laser power to values appropriate for the application. See Table 1 (and Supplemental Figure 1) for parameters used for NTA of small (100 nm) EVs.
NOTE: These advanced settings accessed by clicking the chevron arrow may be password-protected. Use the same settings for recording and processing for the diluent (blank) as those used for the subsequent samples. - Adjust the focus until particles are properly focused. Focusing should be done on relatively small particles (Figure 6). For small EV quantification (consistent with exosomes), the following recording settings are recommended: Frame rate: 30 fps, Exposure: 15 ms, Stir time: 5 s, Wait time: 3 s, Laser power - Blue: 210 mW, Green: 12 mW, Red: 8 mW, Frames per video: 300 frames, and Gain: 30 dB.
NOTE: The user can increase the Zoom to 1x and/or increase the Gain to help with focusing. Remember to re-set these parameters to recommended values before recording videos.

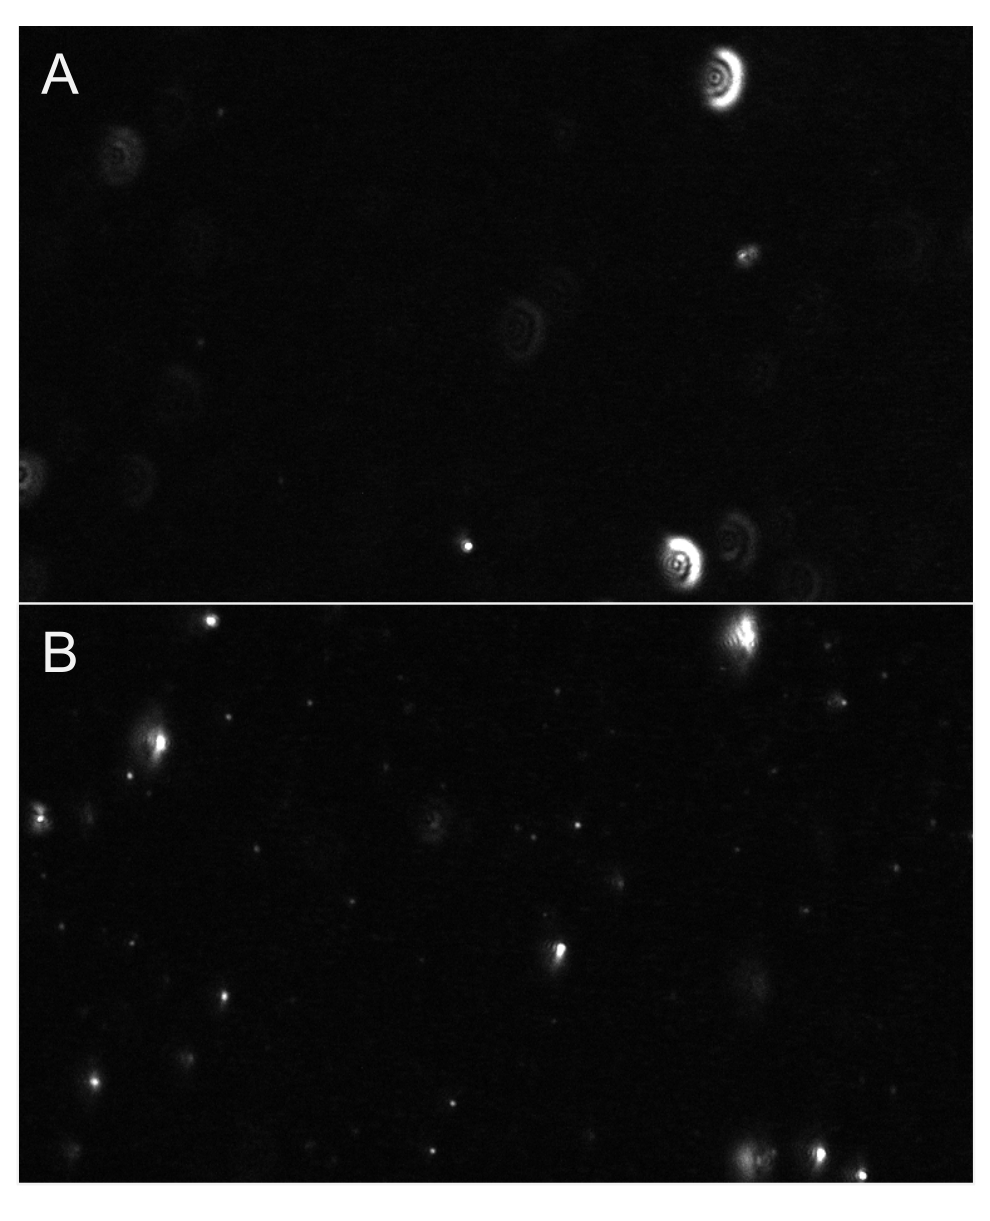
Figure 6: Representative live stream views showing particle focus. (A) An example live stream view of particles not in focus. Particles have glow-like halo or appear blurry. Adjust focus. (B) An example live stream view of particles in proper focus. The smallest particles are in focus. Commence recording. Please click here to view a larger version of this figure.
- Perform a visual quality check to ensure that the sample is properly diluted. If the sample is too concentrated, remove the cuvette from the instrument and dilute the sample sequentially. Repeat until the sample is properly diluted before proceeding to Step 6.
NOTE: Do not over-dilute the sample! Always make dilutions sequentially. The ideal blank will display only a few particles on the screen (1-4) as shown in Figure 4. Regarding EV samples, a properly diluted sample will have roughly 20-100 particles visible on the screen, with no glow-like or cloudy images in the background (see Figure 7 as an example). This should result in an optimum particle concentration in the range of 5 x 10⁶ to 2 x 10⁸ particles per mL (not adjusting for dilution factor).

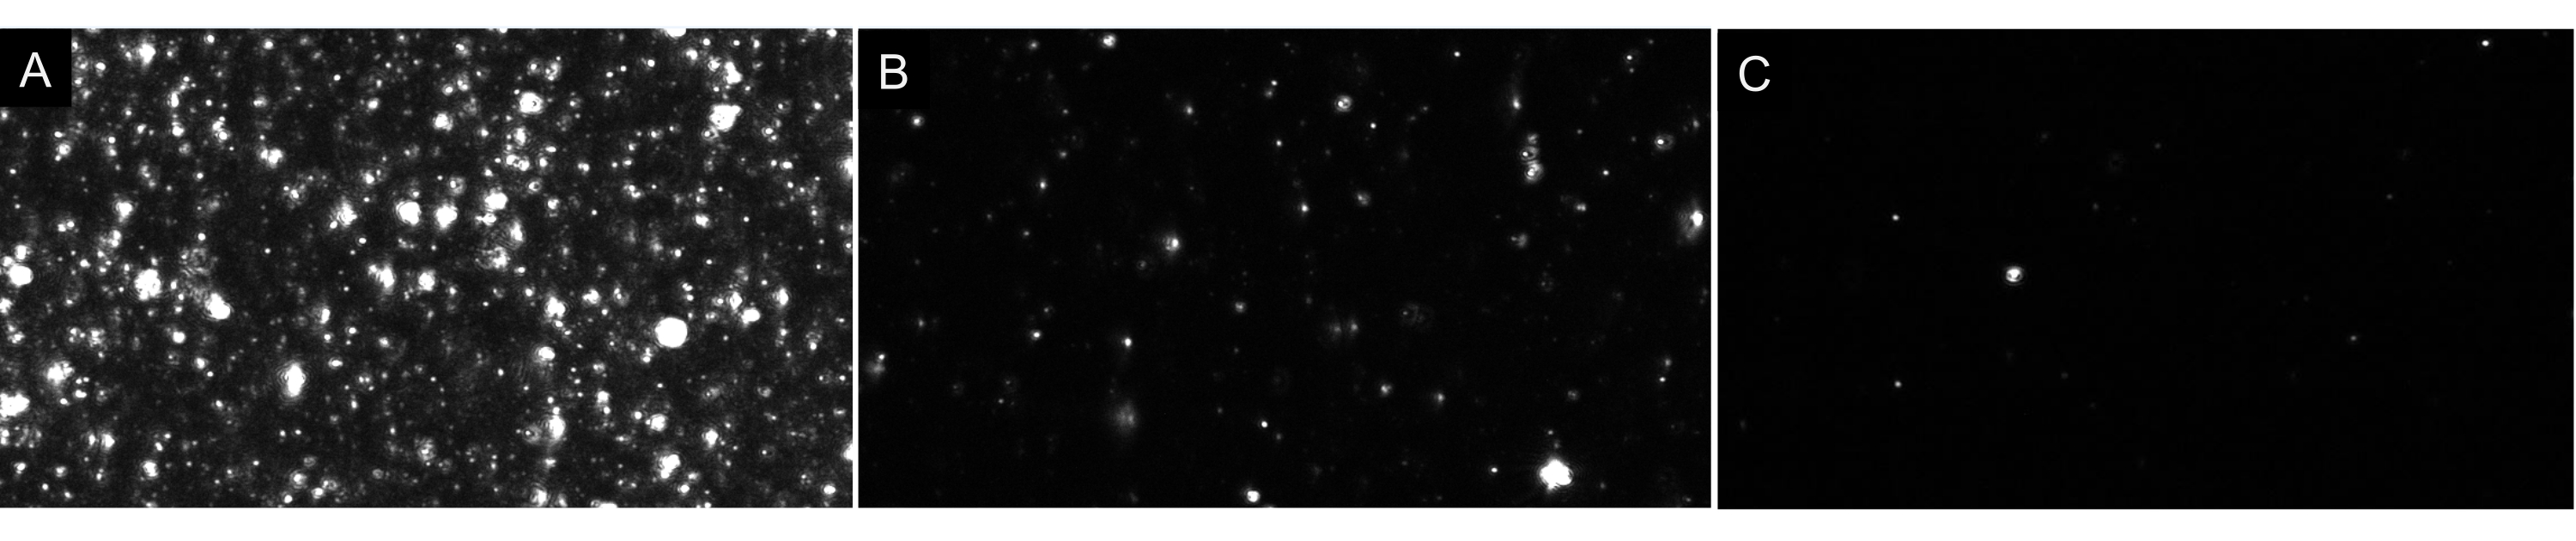
Figure 7: Representative live stream views depicting different particle dilutions. (A) An example live stream view of a sample that is too concentrated. Recording a sample that is too concentrated will yield inaccurate results. (B) An example live stream view of a properly diluted sample. There are 60-100 particles visible on screen and recording results in a raw concentration of 5 x 10⁶- 2 x 10⁸ particles/mL. (C) An example live stream view of a sample that is too dilute. If a sample is this dilute, there will not be enough particles tracked, lowering the sample size and, therefore, the results will be statistically invalid. In this case, increasing the number of videos recorded is recommended. Please click here to view a larger version of this figure.
6. Video data acquisition
- (Optional) Set the zoom setting to 0.5x to save bandwidth and prevent lost frames.
- Begin recording the videos by clicking on Record (see Table 1 for recommended recording parameters).
NOTE: By default, the instrument will stir the sample for 5 s, wait for 3 s, and then record for 10 s before repeating this process. Typical measurement time for 50 videos is ~15 min to record and ~13 min to process. - Do not touch the instrument while recording videos. Ensure that the surface of the laboratory bench is not vibrating.
NOTE: It is preferred that the instrument is set on an anti-vibration platform or table to reduce any vibration disturbances from nearby equipment that will interfere with the determination of nanoparticle movement. Avoid operating centrifuges, vortex mixers, or other potential vibration-generating devices on the same bench as the particle tracking instrument. Vibrations are easily visible on screen as elongation of usually round particles. If exposed to vigorous vibrations, the instrument may require realignment of optical elements. The instrument was not designed to be serviced or calibrated by the customer; contact the manufacturer for maintenance, service, and calibration. - Note any recorded video that has very large particles visible as large, irregular white blobs. Remove these videos from processing in Step 7.3.
7. Process acquired data
- When a prompt appears stating that videos have been recorded, click OK to complete recording. Then select the Process tab.
NOTE: The protocol can be stopped here. Processing of acquired data can be restarted later by moving directly to the Process tab after opening the particle tracking instrument's software and specifying the directory where the recorded videos are saved. - When analyzing EVs, check the box Disable auto detection override and set the Feature Diameter to 30. Click Process. (See Table 2 for processing settings and Supplemental Figure 2 for processing display). A live distribution graph will display so the user can view the processing in real-time.
- For exosomes, process with Detection Threshold set to the default Polydisperse Sample. Process the data with Detection Threshold Manual set to 0.8 instead of a standard threshold of 0.99 only for solutions with very large differences in particle sizes.
- If any videos had noticeably very large particles visible (see Step 6.4), navigate to the directory of recorded videos and remove the problematic video. After editing the list of video files, change the number of recorded videos in other user-kept logs.
- After processing is complete, click OK. Then, select the Plot tab. For EVs, display the Main chart as LogBinSilica.
NOTE: Here in the Plot tab, the user may customize other features of the graph, such as defining the range of the x axis (particle diameter, nm) to set the area for integration for the figure produced.
8. Display and interpret results
- To create a PDF report, click the Report button. The measurement is now complete, and the results may be viewed.
NOTE: Remember to record and process the blank first so that the background concentration of subsequent samples can be corrected. If this step is forgotten, the blank can be recorded after samples and the sample particle concentration corrected manually. - Examine the PDF report which displays the mean, median, and mode size as well as the concentration adjusted for the dilution factor and corrected by subtracting the diluent's particle concentration. The distribution width (standard deviation) is also shown.
NOTE: There are very few applications where a single value is appropriate and representative. Thus, describing the entire size distribution and reporting the width of the distribution for any sample analyzed is recommended (as shown in Table 3 for example). - Record the following instrument settings used to generate the data which should be stated when reporting results: Diluent, Laser power of each laser [mW], Exposure [ms], Gain [dB], Frame rate [fps], Frames per video, Number of videos recorded, Processing setting (e.g., LogBinSilica), Integration range [min nm, max nm] (recommended to set min to 50 nm) and Number of particles tracked (desirable to analyze at least ~150 particles per video; minimum 3,750 total tracks per sample recommended to avoid artifactual spikes in the particle size distribution and generate statistically significant data).
9. Cleaning the cuvettes
- Clean cuvettes manually between samples. First, empty the cuvette.
NOTE: The sample can either be recovered from the cuvette and saved or discarded. - Once the cuvette is empty, clean the cuvette by rinsing it 10-15 times with de-ionized (DI) water. Then, rinse 3 times with ethanol (70-100%). When doing this, make sure to completely fill the cuvette with solvent.
- Dry the outside of the cuvette with a lint free microfiber cloth. Avoid smudges on the surfaces. Air dry the inside of the cuvette or dry using a compressed air duster.
NOTE: Only lens cleaning paper or lint free microfiber cloth should be used to wipe the optical surfaces of the cuvette, as most paper products contain small wood fibers that may scratch or damage the cuvette's surface. - Prepare two glass scintillation vials: one filled with 70-100% ethanol and the other with DI water. Rinse the inserts and stir bars in the ethanol first (then DI water) by placing the insert/stir bar in the appropriate scintillation vial and shaking the vial vigorously. Dry the inserts and stir bars using lint free cloths or compressed air dusters.
NOTE: The cuvette and insert can also be cleaned using a sonicating water bath. To do so, first ensure the sonicating unit contains enough water (at least 5 cm depth). Then place the cuvette and insert inside a glass beaker (50 mL or larger), fill the beaker with alcohol to the same level as the water bath, place the beaker in the water, and switch on the power. Sonicate for a maximum of 5 min at a time, allowing the machine to rest >5 min between each 5-min burst if longer times are required. - When finished, immediately put all cleaned and dried components away for storage.
Results
Before this demonstration, the calibration of the instrument was first tested to ensure the validity of the acquired data by measuring the size distribution of polystyrene bead standards. We tested the size distribution of 100 nm and 400 nm beads using the default recording parameters and the processing settings recommended in this protocol (Figure 8).
For the 100 nm polystyrene bead standard, a concentration of 4.205 x 10⁷ particles/mL was measured. Th...
Discussion
Here, we demonstrate a protocol for NTA of EVs to measure the size distribution of a wide range of particle sizes simultaneously and measure total EV concentration in a polydisperse sample. In this study, mouse perigonadal adipose tissue and human plasma were used as the source of EVs. However, EVs isolated from other tissues or biological fluids such as serum, urine, saliva, breast milk, amniotic fluid, and cell culture supernatant may also be used for NTA. Measurements of polystyrene bead standards ensured that the ins...
Disclosures
All authors declared that there are no conflicts of interest.
Acknowledgements
This work was supported by the National Institutes of Health (ES030973-01A1, R01ES025225, R01DK066525, P30DK026687, P30DK063608). We acknowledge Jeffrey Bodycomb, Ph.D. of HORIBA Instruments Incorporated for his help calibrating the instrument.
Materials
| Name | Company | Catalog Number | Comments |
| 1X dPBS | VWR | 02-0119-1000 | To dilute samples |
| 100 nm bead standard | Thermo Scientific | 3100A | To test ViewSizer 3000 calibration |
| 400 nm bead standard | Thermo Scientific | 3400A | To test ViewSizer 3000 calibration |
| Centrifugal Filter Unit | Amicon | UFC901024 | To filter PBS diluent |
| Collection tubes, 2 mL | Qiagen | 19201 | For isolation of human plasma extracellular vesicles |
| Compressed air duster | DustOff | DPSJB-12 | To clean cuvettes |
| Cuvette insert | HORIBA Scientific | - | Provided with purchase of ViewSizer 3000 |
| Cuvette jig | HORIBA Scientific | - | To align magnetic stir bar while placing inserts inside cuvette; Provided with purchase of ViewSizer 3000 |
| De-ionized water | VWR | 02-0201-1000 | To clean cuvettes |
| Desktop computer with monitor, keyboard, mouse, and all necessary cables | Dell | - | Provided with purchase of ViewSizer 3000 |
| Ethanol (70-100%) | Millipore Sigma | - | To clean cuvettes |
| ExoQuick ULTRA | System Biosciences | EQULTRA-20A-1 | For isolation of human plasma extracellular vesicles |
| Glass scintillation vials with lids | Thermo Scientific | B780020 | To clean cuvettes |
| "Hook" tool | Excelta | - | Provided with purchase of ViewSizer 3000 |
| Lint-free microfiber cloth | Texwipe | TX629 | To clean cuvettes and cover work surface |
| Microcentrifuge tubes, 2 mL | Eppendorf | 22363344 | For isolation of human plasma extracellular vesicles |
| Stir bar | Sp Scienceware | F37119-0005 | |
| Suprasil Quartz cuvette with cap | Agilent Technologies | AG1000-0544 | Initially provided with purchase of ViewSizer 3000 |
| ViewSizer 3000 | HORIBA Scientific | - | Nanoparticle tracking instrument |
References
- Colombo, M., Raposo, G., Théry, C. Biogenesis, secretion, and intercellular interactions of exosomes and other extracellular vesicles. Annual Review of Cell and Developmental Biology. 30, 255-289 (2014).
- Hessvik, N. P., Llorente, A. Current knowledge on exosome biogenesis and release. Cellular and molecular life sciences: CMLS. 75, 193-208 (2018).
- Johnstone, R. M., Adam, M., Hammond, J. R., Orr, L., Turbide, C. Vesicle formation during reticulocyte maturation. Association of plasma membrane activities with released vesicles (exosomes). The Journal of Biological Chemistry. 262, 9412-9420 (1987).
- Théry, C., Ostrowski, M., Segura, E. Membrane vesicles as conveyors of immune responses. Nature Reviews Immunology. 9, 581-593 (2009).
- Yáñez-Mó, M., et al. Biological properties of extracellular vesicles and their physiological functions. Journal of Extracellular Vesicles. 4, 27066 (2015).
- Lo Cicero, A., Stahl, A., Raposo, G. Extracellular vesicles shuffling intercellular messages: for good or for bad. Current Opinion in Cell Biology. 35, 69-77 (2015).
- Raposo, G., Stoorvogel, W. Extracellular vesicles: exosomes, microvesicles, and friends. The Journal of Cell Biology. 200, 373-383 (2013).
- Mathivanan, S., Ji, H., Simpson, R. J. Exosomes: extracellular organelles important in intercellular communication. Journal of Proteomics. 73, 1907-1920 (2010).
- Zhang, M., et al. Methods and technologies for exosome isolation and characterization. Small Methods. 2, 1800021 (2018).
- Szatanek, R., et al. The methods of choice for extracellular vesicles (EVs) characterization. International Journal of Molecular Sciences. 18, (2017).
- Erdbrügger, U., Lannigan, J. Analytical challenges of extracellular vesicle detection: A comparison of different techniques. Cytometry. Part A: The Journal of the International Society for Analytical Cytology. 89, 123-134 (2016).
- Konoshenko, M. Y., Lekchnov, E. A., Vlassov, A. V., Laktionov, P. P. Isolation of Extracellular Vesicles: General Methodologies and Latest Trends. BioMed Research International. 2018, 1-27 (2018).
- Cvjetkovic, A., Lötvall, J., Lässer, C. The influence of rotor type and centrifugation time on the yield and purity of extracellular vesicles. Journal of Extracellular Vesicles. 3, (2014).
- Taylor, D. D., Shah, S. Methods of isolating extracellular vesicles impact down-stream analyses of their cargoes. Methods. 87, 3-10 (2015).
- Desdín-Micó, G., Mittelbrunn, M. Role of exosomes in the protection of cellular homeostasis. Cell Adhesion & Migration. 11, 127-134 (2017).
- Kanemoto, S., et al. Multivesicular body formation enhancement and exosome release during endoplasmic reticulum stress. Biochemical and Biophysical Research Communications. 480, 166-172 (2016).
- Benedikter, B. J., et al. Cigarette smoke extract induced exosome release is mediated by depletion of exofacial thiols and can be inhibited by thiol-antioxidants. Free Radical Biology & Medicine. 108, 334-344 (2017).
- Saeed-Zidane, M., et al. Cellular and exosome mediated molecular defense mechanism in bovine granulosa cells exposed to oxidative stress. PloS One. 12, 0187569 (2017).
- Wang, K., et al. Mechanical stress-dependent autophagy component release via extracellular nanovesicles in tumor cells. ACS Nano. 13, 4589-4602 (2019).
- King, H. W., Michael, M. Z., Gleadle, J. M. Hypoxic enhancement of exosome release by breast cancer cells. BMC Cancer. 12, 421 (2012).
- Bonzini, M., et al. Short-term particulate matter exposure induces extracellular vesicle release in overweight subjects. Environment Research. 155, 228-234 (2017).
- Neri, T., et al. Particulate matter induces prothrombotic microparticle shedding by human mononuclear and endothelial cells. Toxicology In Vitro. 32, 333-338 (2016).
- Flaherty, S. E., et al. A lipase-independent pathway of lipid release and immune modulation by adipocytes. Science. 363, 989-993 (2019).
- van Niel, G., D'Angelo, G., Raposo, G. Shedding light on the cell biology of extracellular vesicles. Nature Reviews. Molecular Cell Biology. 19, 213-228 (2018).
- Dragovic, R. A., et al. Sizing and phenotyping of cellular vesicles using Nanoparticle Tracking Analysis. Nanomedicine: Nanotechnology, Biology, and Medicine. 7, 780-788 (2011).
- Saveyn, H., et al. Accurate particle size distribution determination by nanoparticle tracking analysis based on 2-D Brownian dynamics simulation. Journal of Colloid and Interface Science. 352, 593-600 (2010).
- Vander Meeren, P., Kasinos, M., Saveyn, H. Relevance of two-dimensional Brownian motion dynamics in applying nanoparticle tracking analysis. Methods in Molecular Biology. , 525-534 (2012).
- Filipe, V., Hawe, A., Jiskoot, W. Critical evaluation of Nanoparticle Tracking Analysis (NTA) by NanoSight for the measurement of nanoparticles and protein aggregates. Pharmaceutical Research. 27, 796-810 (2010).
- Bachurski, D., et al. Extracellular vesicle measurements with nanoparticle tracking analysis - An accuracy and repeatability comparison between NanoSight NS300 and ZetaView. Journal of Extracellular Vesicles. 8, 1596016 (2019).
- Varga, Z., et al. Hollow organosilica beads as reference particles for optical detection of extracellular vesicles. Journal of Thrombosis and Haemostasis. 16, 1646-1655 (2018).
- Serrano-Pertierra, E., et al. Extracellular vesicles: Current analytical techniques for detection and quantification. Biomolecules. 10, (2020).
- Maguire, C. M., Rösslein, M., Wick, P., Prina-Mello, A. Characterisation of particles in solution - a perspective on light scattering and comparative technologies. Science and Technology of Advanced Materials. 19, 732-745 (2018).
- Bohren, C. F., Huffman, D. R. . Absorption and Scattering of Light by Small Particles. , (1983).
Reprints and Permissions
Request permission to reuse the text or figures of this JoVE article
Request PermissionExplore More Articles
This article has been published
Video Coming Soon
Copyright © 2025 MyJoVE Corporation. All rights reserved