
A subscription to JoVE is required to view this content. Sign in or start your free trial.
Method Article
Automated Imaging and Analysis for the Quantification of Fluorescently Labeled Macropinosomes
In This Article
Summary
Automated assays using multi-well microplates are advantageous approaches for identifying pathway regulators by allowing the assessment of a multitude of conditions in a single experiment. Here, we have adapted the well-established macropinosome imaging and quantification protocol to a 96-well microplate format and provide a comprehensive outline for automation using a multi-mode plate reader.
Abstract
Macropinocytosis is a non-specific fluid-phase uptake pathway that allows cells to internalize large extracellular cargo, such as proteins, pathogens, and cell debris, through bulk endocytosis. This pathway plays an essential role in a variety of cellular processes, including the regulation of immune responses and cancer cell metabolism. Given this importance in biological function, examining cell culture conditions can provide valuable information by identifying regulators of this pathway and optimizing conditions to be employed in the discovery of novel therapeutic approaches. The study describes an automated imaging and analysis technique using standard laboratory equipment and a cell imaging multi-mode plate reader for the rapid quantification of the macropinocytic index in adherent cells. The automated method is based on the uptake of high molecular weight fluorescent dextran and can be applied to 96-well microplates to facilitate assessments of multiple conditions in one experiment or fixed samples mounted onto glass coverslips. This approach is aimed at maximizing reproducibility and reducing experimental variation while being both time-saving and cost-effective.
Introduction
The non-specific endocytic pathway of macropinocytosis allows cells to internalize a variety of extracellular components, including nutrients, proteins, antigens, and pathogens, through bulk uptake of extracellular fluid and its constituents1. Though important for the biology of numerous cell types, increasingly, the macropinocytosis pathway is described to play an essential role in tumor biology, where, through macropinocytic uptake, tumor cells are able to survive and proliferate in the presence of a nutrient-depleted microenvironment2,3. The uptake of extracellular macromolecules, including albumin and extracellular matrix, and necrotic cell debris, provides an alternative nutrient source for biomass production by creating amino acids, sugars, lipids and nucleotides through macropinosome and lysosome fusion-mediated cargo catabolism4,5,6,7,8.
The induction and regulation of macropinocytosis are complex and can vary depending on cellular context. Thus far, several inducers of macropinocytosis have been identified and include ligands, such as epidermal growth factor (EGF), platelet-derived growth factor (PDGF), galectin-3, and Wnt3A9,10,11,12,13. In addition, culturing conditions that mimic the tumor microenvironment can trigger activation of the pathway. Pancreatic ductal adenocarcinoma (PDAC) tumors are nutrient-deprived, especially for the amino acid glutamine, which causes both cancer cells and cancer-associated fibroblasts (CAFs) to rely on macropinocytosis for survival7,13,14,15. Moreover, tumor stresses, such as hypoxia and oxidative stress, can activate this scavenging pathway16. In addition to the numerous extrinsic influencers that can induce macropinocytosis, a variety of intracellular pathways control macropinosome formation. Oncogenic Ras-mediated transformation is sufficient to initiate the macropinocytic machinery, and multiple cancer types exhibit oncogenic Ras-driven constitutive macropinocytosis4,5,9,17. Alternatively, wild-type Ras activation and Ras-independent pathways have been identified to activate macropinocytosis in cancer cells and CAFs10,11,15,18. The use of various in vitro models in combination with inhibitor treatments has resulted in the identification of several macropinocytosis modulators, which include sodium-hydrogen exchangers, the small GTPase Rac1, phosphoinositide 3-kinase (PI3K), p21-activated kinase (Pak), and AMP-activated protein kinase (AMPK)4,13,15. However, given the multitude of described factors and conditions that regulate macropinocytosis, it is conceivable that many more modulators and stimuli remain undiscovered. The identification of novel modulators and stimuli can be facilitated by automated assessment of a multitude of conditions in a single experiment. This methodology can shed light on the factors involved in macropinosome formation and may allow for the discovery of novel small molecules or biologics that target this pathway.
Here, we have adapted our previously established protocol for determining the extent of macropinocytosis in cancer cells in vitro to a 96-well microplate format and automated imaging and quantification19,20. This protocol is based on fluorescent microscopy, which has become a standard in the field to determine macropinocytosis in vitro and in vivo4,5,6,7,9,10,11,12,13,15,16,17,18,19,20,21,22. Macropinosomes can be distinguished from other endocytic pathways through their ability to internalize large macromolecules, such as high molecular weight dextran (i.e., 70 kDa)2,3,4,20,21,22,23. Thus, macropinosomes can be defined through uptake of extracellularly administered fluorophore-labeled 70 kDa dextran. As a result, macropinocytic vesicles manifest as intracellular clusters of fluorescent puncta with sizes ranging from 0.2-5 µm. These puncta can be microscopically imaged and subsequently quantified to determine the extent of macropinocytosis in the cell - 'the macropinocytic index'.
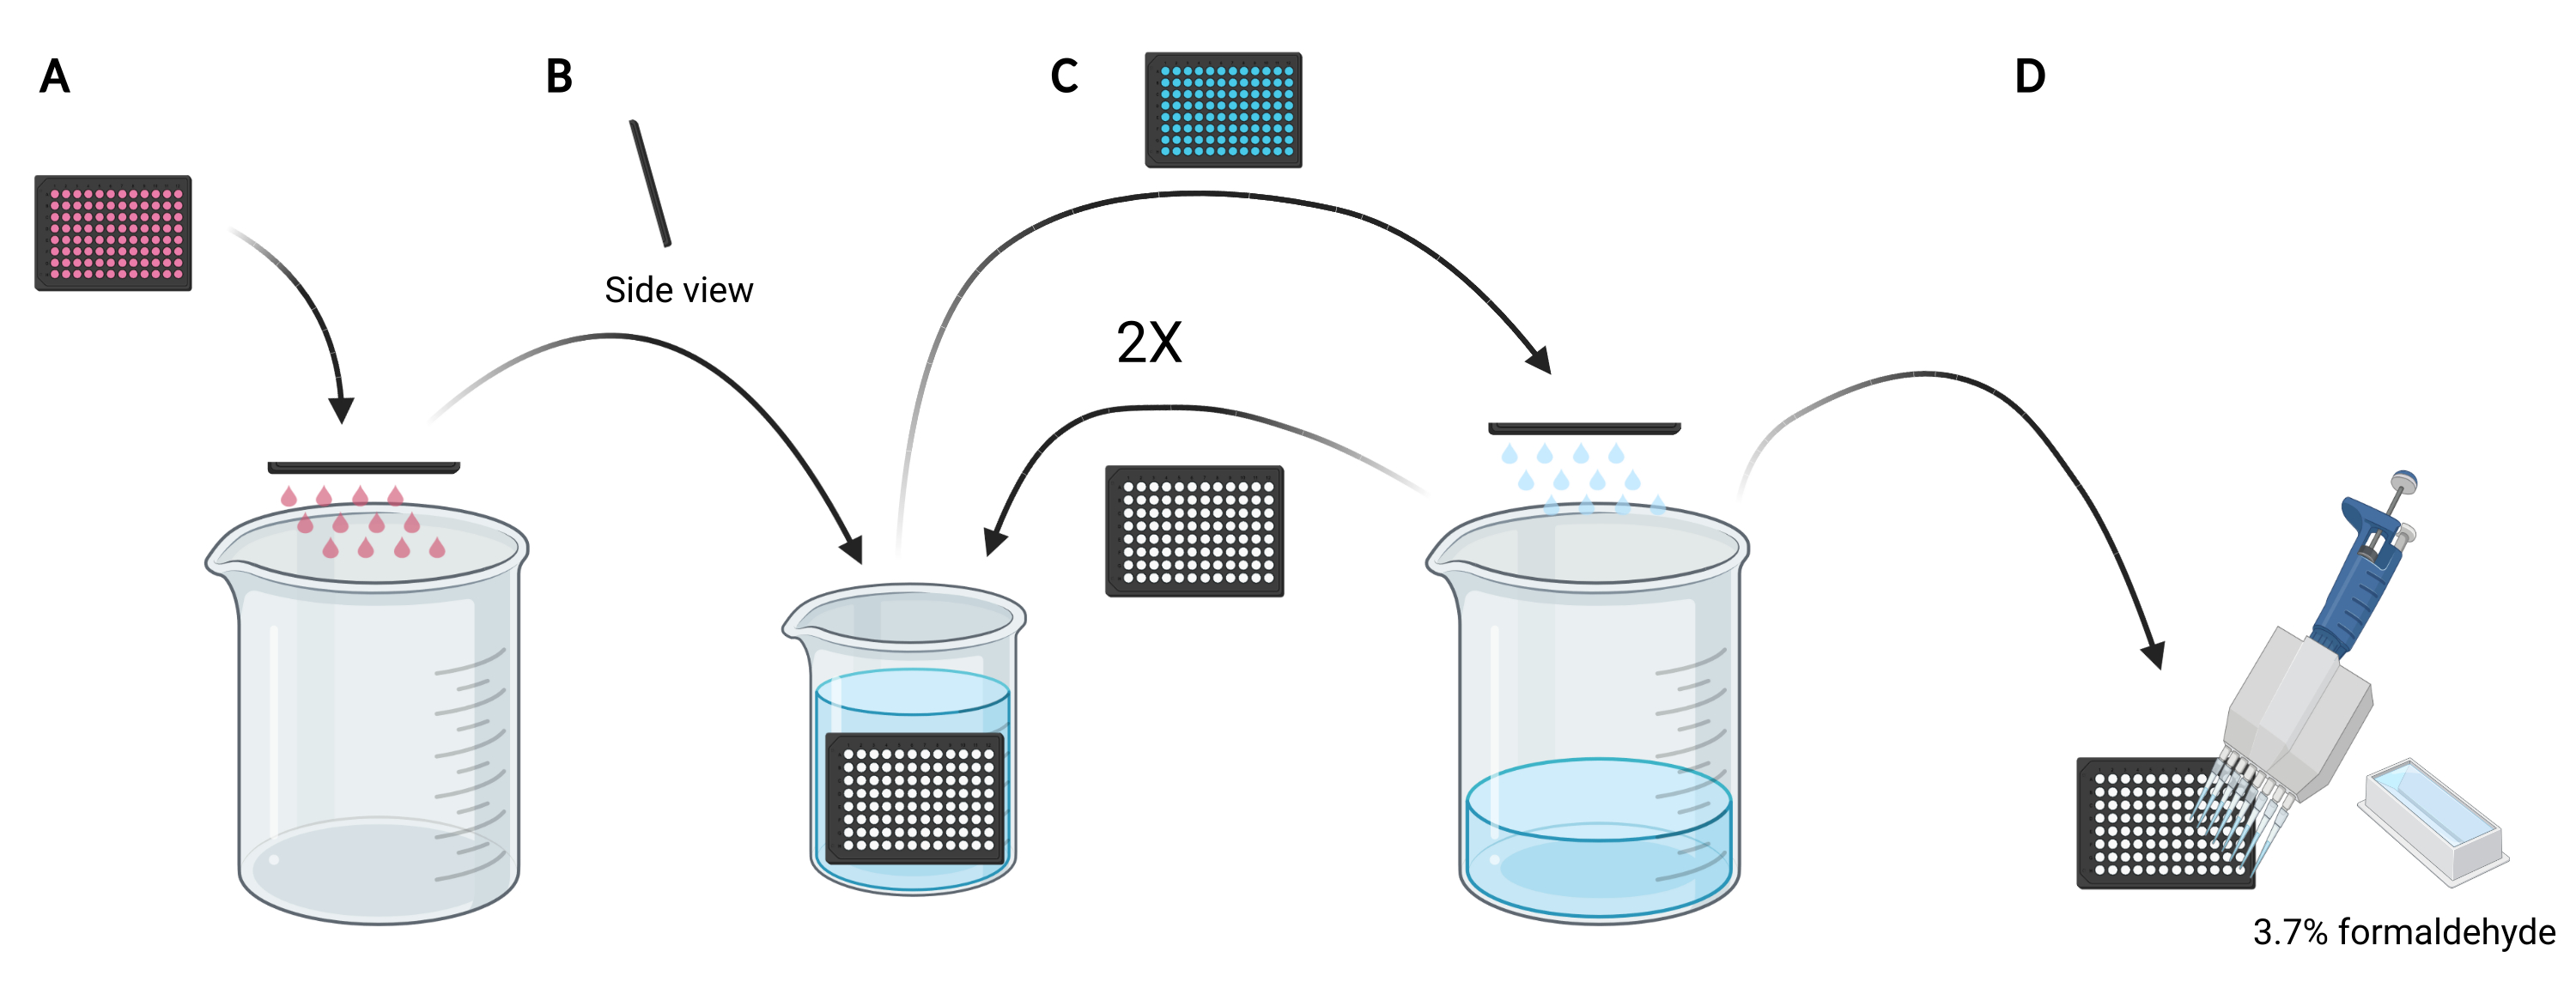
In this protocol, the essential steps to visualize macropinosomes in adherent cells in vitro on a 96-well microplate and coverslips using standard laboratory equipment are described (Figure 1). In addition, the directions to automate the image acquisition and quantification of the macropinocytic index using a cell imaging multi-mode plate reader are provided. This automation reduces time, cost, and effort compared to our previously described protocols19,20. In addition, it avoids unintentionally biased imaging acquisition and analysis and thereby enhances reproducibility and reliability. This method can easily be adapted to different cell types or plate readers or be utilized to determine alternative macropinosome features, such as size, number, and location. The herein described method is especially suitable for the screening of cell culture conditions that induce macropinocytosis, the identification of novel modulators, or optimization of drug concentrations of known inhibitors.

Figure 1: Schematic of the automated assay to determine the 'macropinocytic index' in adherent cells. Created using BioRender. Please click here to view a larger version of this figure.
Protocol
1. Preparation of materials
- Dissolve 70 kDa dextran labeled with FITC or tetramethylrhodamine (TMR) in PBS to obtain a 20 mg/mL solution. Store the aliquots at -20 °C.
- Dissolve DAPI in ddH2O to obtain a 1 mg/mL solution. Store the aliquots at -20 °C.
CAUTION: DAPI is a potential carcinogen and should be handled with care. - On the day of fixation, prepare fresh 3.7% ACS grade formaldehyde in PBS.
CAUTION: Formaldehyde is a fixative, known carcinogen and is toxic if inhaled. Make the solution in a chemical fume hood to avoid inhalation and handle with care. - Prepare acid-washed coverslips.
- Use a 500 mL beaker and water bath to heat 28 g of borosilicate glass coverslips with a 12 mm diameter and #1.5 thickness for 24 h at 56 °C in 100 mL of 1 M HCl. Seal the beaker with plastic wrap to avoid extensive evaporation.
CAUTION: HCl is a strong acid that is highly corrosive and should thus be handled with care and used in a chemical fume hood to avoid inhalation. - Wash the coverslips with distilled water. Repeat the wash 4 times. Then wash the coverslips with 95% ethanol. Repeat the wash 4 times.
- Store the acid-washed coverslips in a cell culture dish at room temperature for future use by maintaining sterility through submersion in 95% ethanol. Seal the dish with parafilm to avoid extensive evaporation.
- Use a 500 mL beaker and water bath to heat 28 g of borosilicate glass coverslips with a 12 mm diameter and #1.5 thickness for 24 h at 56 °C in 100 mL of 1 M HCl. Seal the beaker with plastic wrap to avoid extensive evaporation.
2. Preparation of cells
- Using a confluent 10 cm tissue culture plate with the adherent cells of interest, aspirate the media and rinse the cells with 5 mL of DPBS, prewarmed at 37 °C.
- Detach the cells from the plate by adding 1.5 mL of prewarmed 0.25% trypsin and incubating at 37 °C.
NOTE: The trypsin incubation time required to detach the cells of interest should be empirically determined and can be confirmed by observing detachment under a conventional light microscope. - Collect the cells in a 15 mL centrifuge tube and add 4.5 mL of complete media to quench the trypsin.
- Pellet the cells by centrifugation for 3 min at 200 x g and aspirate the supernatant.
- Resuspend the cell pellet in an adequate volume of prewarmed complete media to obtain a single cell suspension for seeding.
- Proceed to seed the cells on a 24-well plate with coverslips or a 96-well microplate format (Figure 1).
NOTE: The number of cells to be seeded should be empirically determined for each cell line as proliferation rates and size vary between cell lines. This protocol has been optimized for adherent cancer cells with 80% cell confluency on the day of macropinosome labeling. Cell confluency may affect macropinocytic capacity, and this should also be determined empirically.- 24-well plate with coverslip format
- Add coverslips to a 24-well tissue culture plate, use forceps to grip a single coverslip from the ethanol bath. Tap the coverslip to the inside wall of the plate to remove excess ethanol and place the coverslip flat on the bottom of a well.
- Let the ethanol evaporate and wash the coverslip 2 times with DPBS.
- Seed the cells on top of the coverslip by adding 500 µL of the cell suspension to each well. Place the cells in a 37 °C cell incubator with 5% CO2 until cell confluency reaches 60%-80% on the day before macropinosome labeling.
- The day before macropinosome labeling, aspirate the media from the wells and add 500 µL of prewarmed serum-free media to each well and place the cells in a 37 °C cell incubator with 5% CO2 for 16-24 h.
NOTE: Depending on the conditions to be studied, serum-free media is recommended to reduce the effects of growth factors that can induce macropinocytosis and which are normally present in serum. However, it should be considered that serum starvation may affect other cellular processes, such as proliferation and autophagy. As residual serum can affect the macropinocytic capacity of cells, as well as inhibitor activity, removal of serum can be improved by gently rinsing the cells 1 or 2 times with 500 µL of prewarmed DPBS.
- 96-well microplate format
- Transfer the cell suspension to a 25 mL reagent reservoir. Using a multichannel pipette (8 or 12 channels), seed 100 µL of the cell suspension to each well of a black 96-well high-content screening microplate with optically-clear cyclic olefin or glass-bottom.
- Place the cells in a 37 °C cell incubator with 5% CO2 until cell confluency reaches 60%-80% on the day before macropinosome labeling.
- The day before macropinosome labeling, remove and discard the media from each well using a multichannel pipette (8 or 12 channels) or a multichannel aspiration adapter for standard tips attached to a vacuum pump.
- Using a reagent reservoir and multichannel pipette (8 or 12 channels), gently add 100 µL of prewarmed serum-free media to each well. Place the cells in a 37 °C cell incubator with 5% CO2 for 16-24 h.
NOTE: Depending on the conditions to be studied, serum-free media is recommended to reduce the effects of growth factors that can induce macropinocytosis and which are normally present in serum. However, it should be considered that serum starvation may affect other cellular processes, such as proliferation and autophagy. As residual serum can affect the macropinocytic capacity of cells, as well as inhibitor activity, removal of serum can be improved by gently rinsing the cells 1 or 2 times with 100 µL prewarmed DPBS.
- 24-well plate with coverslip format
3. Macropinosome labeling
- 24-well plate with coverslip format
- Aspirate the wells and add back 200 µL of serum-free media with 1 mg/mL fluorophore-labeled high molecular weight (70 kDa) dextran. Place the cells in a 37 °C cell incubator for 30 min.
NOTE: Depending on the conditions to be studied, instead of using fresh media, reusing the conditioned media for dextran loading may be preferred as it would contain secreted or supplemented factors, such as EGF or inhibitor compounds, respectively, that can affect the macropinocytic capacity of the cells. - Aspirate the media and gently but quickly wash the cells 5 times with ice-cold PBS using a precooled wash bottle. Firmly shake the plate by hand during washes to aid in dislodging dextran aggregates that become stuck to the coverslips.
- Fix the cells by adding 350 µL of 3.7% formaldehyde and incubating for 20 min. Then, aspirate the fixation solution and wash the cells with PBS twice.
- Stain the nuclei with 350 µL of 2 µg/mL DAPI in PBS. After 20 min, aspirate the DAPI solution and wash the cells with PBS thrice.
- Adhere silicone isolators side-by-side on a microscope slide to obtain even spacing and reproducible localization of the coverslips, required for imaging automation (Figure 2A,B).
NOTE: The entire microscope slide can be populated with a total of 3 isolators. - For each coverslip, add a drop of hardening fluorescence mounting media on the microscope slide within the open space of the isolator (Figure 2C). Pick up a coverslip using forceps and remove excess PBS by gently tapping the side of the coverslips on a lint-free wipe.
- Place the coverslip upside down on the drop of mounting media (Figure 2D). Gently tap the coverslip using closed forceps to remove bubbles from the mounting media (Figure 2E).
- Store the slides in a dark environment and allow the mounting media to dry at room temperature, typically taking 16-24 h. Slides may now be imaged or stored at -20 °C for up to 2 weeks.
- Before imaging, remove the isolators from the microscope slide. Let the slides equilibrate to room temperature and clean the coverslips using a cotton-tipped applicator wetted with ammonia-free glass cleaner. Subsequently, use a clean cotton-tipped applicator wetted with 70% ethanol to clean and leave the coverslip dry.
- Aspirate the wells and add back 200 µL of serum-free media with 1 mg/mL fluorophore-labeled high molecular weight (70 kDa) dextran. Place the cells in a 37 °C cell incubator for 30 min.

Figure 2: Placing coverslips on a microscope slide with silicone isolators. (A) Silicone isolators are pressed and adhered to a microscope slide. (B) The entire microscope slide can be populated with a total of 3 isolators, resulting in even spacing and reproducible localization of the coverslips. (C) For each coverslip, add a drop of fluorescence mounting media on the microscope slide within the open space of the isolator. (D) Using forceps, pick up a coverslip from the 24-well plate and place it upside down on the drop of mounting media. (E) When bubbles are present between the coverslip and microscope slide, gently tap the coverslip using closed forceps to remove bubbles. Created using BioRender. Please click here to view a larger version of this figure.
- 96-well microplate format
- Aspirate the wells using a multichannel aspiration adapter attached to a vacuum and add 40 µL of serum-free media with 1 mg/mL fluorophore-labeled high molecular weight (70 kDa) dextran back to the wells. Incubate the cells in a 37 °C cell incubator for 30 min.
NOTE: Depending on the conditions to be studied, instead of using fresh media, reusing the conditioned media for dextran loading may be preferred as it would contain secreted or supplemented factors, such as EGF or inhibitor compounds, respectively that can affect the macropinocytic capacity of the cells. - Dispose of the media in the microplate by manually flicking the plate upside down into an empty 5 L beaker (Figure 3A).
- Rinse the cells in the microplate by slowly submerging the plate vertically, at a slight angle, into a 2 L beaker filled with ice-cold PBS (Figure 3B) and subsequently dispose of the PBS in the microplate by flicking the plate upside down into the 5 L beaker (Figure 3C). Repeat 2 times.
NOTE: Cells that weakly attach to the imaging microplate may detach during this process. If required, wells can also be aspirated with a multichannel aspiration adapter or more gently washed with PBS using a multichannel pipette. Processing one 96-well microplate will require approximately 2 L of ice-cold PBS. If more plates are to be analyzed, use a larger beaker, and add 1 L of ice-cold PBS for each additional plate or refresh the ice-cold PBS as necessary. - Following the disposal of the PBS from the last rinse, fix the cells for 20 min at room temperature by adding 100 µL of 3.7% formaldehyde in PBS to each well using a 25 mL reagent reservoir and a multichannel pipette (Figure 3D).
- Remove the fixation solution and wash the cells with PBS twice using the submerging and flicking technique. Stain the nuclei with 100 µL of 2 µg/mL DAPI in PBS per well.
- After 20 min, rinse the cells thrice with ice-cold PBS using the submerging and flicking technique described above (step 3.2.3). Remove any residual PBS by tapping the microplate upside-down onto a lint-free wipe and add 100 µL of fresh PBS to each well using a 25 mL reagent reservoir and multichannel pipette. Image the cells now or store them covered from light at 4 °C for up to one week.
NOTE: Alternatively, a solution of glycerol in PBS (instead of PBS) can be used for imaging and storage to better stabilize the fluorescence (Figure 4A). - Before imaging, let the plate equilibrate to room temperature. Wipe the microplate dry with a lint-free wipe.
- Aspirate the wells using a multichannel aspiration adapter attached to a vacuum and add 40 µL of serum-free media with 1 mg/mL fluorophore-labeled high molecular weight (70 kDa) dextran back to the wells. Incubate the cells in a 37 °C cell incubator for 30 min.

Figure 3: Rinsing the 96-well microplate to prepare for fixation. (A) Empty the microplate of media into a 5 L beaker by manually flicking. (B) Vertically and at a slight angle, slowly submerge the microplate in a 2 L beaker filled with ice-cold PBS. (C) Empty the microplate of PBS into the 5 L beaker by manually flicking. Repeat the wash steps as described in B two times. (D) After emptying the PBS in the microplate for the last time, add 100 µL 3.7% formaldehyde to the wells, using a multichannel pipette. Created using BioRender. Please click here to view a larger version of this figure.
4. Automated macropinosome imaging
Images of macropinosomes can be captured using a standard fluorescent microscope, as previously described19,20. However, such a procedure can be improved upon in terms of efficiency through automation, especially when assessing numerous different cell culture conditions. Automation of image acquisition can be accomplished via a cell imaging multi-mode plate reader, which decreases effort by reducing handling procedures and, importantly, increases data reproducibility and reliability by acquiring images in an unbiased fashion. Multiple imaging systems are commercially available, and directions will differ between instruments. Here, acquiring images using a Cytation 5 is described. However, the protocol below can be tailored to each individual instrument by adhering to the following guidelines:
- Create an automation protocol to acquire the images with a 40x air objective in the wavelength channel of the dextran fluorophore (FITC/TMR) and DAPI.
NOTE: The commonly used macropinocytosis inhibitor EIPA exhibits autofluorescence in the FITC channel, especially when previously excited in the DAPI channel. Other compounds being tested might also display autofluorescence. To circumvent this issue, setting the image acquisition to occur first in the channel with the highest excitation wavelength (FITC/TMR) and second in the DAPI channel helps to avoid this occurrence. - Optimize exposure settings using a sample predicted to have the highest level of macropinocytosis to avoid overexposure, which may result in saturation of the signal and loss of intensity data. Use focus settings that readily and consistently locate the sample to produce high-quality images.
- Acquire multiple images across each well or coverslip to account for sample variability and obtain an accurate representation of the sample.
- Once the imaging settings have been determined, use the same settings for each sample within the experiment.
- Follow these instructions for macropinosome image acquisition when using a Cytation 5 and Gen5 software:
- 24-well plate with coverslip format
- Start the plate reader and insert the microscope slides upside down using the slide holder.
- Open the microplate reader and imaging software, create a new protocol by clicking on Protocols, and Create New. Double click on Procedure and select the plate type.
NOTE: If the plate type is not available, add the plate type to the software by clicking on System > Plate Types > Add Plate, and using the plate dimensions as provided by the manufacturer. For ease of use, the template for two microscope slides with three coverslips spaced using the silicone isolators is provided in Supplementary File 1. - To access the imaging settings, select Actions > Image > Inverted imager and click on OK. Use the 40x, PL FL Phase objective with Wide FOV and Autofocus Binning.
- For the first channel, select the LED cube corresponding to the dextran fluorophore-label (GFP or RFP). Unclick Auto Exposure and click the microscope icon button to optimize exposure settings. When the appropriate exposure settings have been determined, click on Save Settings.
NOTE: Adjust the exposure settings using a sample predicted to have the highest level of macropinocytosis to avoid overexposed images, which can result in saturation of the signal and loss of intensity data. - Repeat the previous step for the second channel using the DAPI LED cube.
- Set the autofocus settings for each fluorescence channel, select Focus Options. Unselect the default focus method and use Autofocus with Optional Scan and Autofocus without Optional Scan for the dextran-fluorophore and DAPI channel, respectively. Click on OK to save the settings.
NOTE: The scan distance can be reduced to 200 µm and the increment to 20 µm to increase autofocus efficiency. The optional scan is required for adequate autofocus on samples that have low fluorescence. This normally occurs when analyzing conditions with low macropinocytosis, such as when macropinocytosis is inhibited or not innately present. - Use the Define Beacons option to automate the acquisition of images at different regions of the coverslip. Click the microscope icon and add beacons by clicking in the image window and moving the stage to the next region. When the appropriate number of regions have been selected, move to the next coverslip and repeat the process. To finalize, click on Save Settings.
NOTE: To obtain a good representation of macropinocytosis across the sample, select approximately 20 beacons that are evenly distributed across the coverslip (Figure 4B). Less beacons can be used, but some images may have to be excluded from image analysis after acquisition due to quality discrepancies, such as when the image is out-of-focus or contains bubbles or fluorescent blotches and smudges. - To complete the adjustment of imaging settings, click on OK. To image the coverslips, select Create a New Experiment and Read Now from the Protocol Tools. Save the protocol and the experiment when prompted.
- 24-well plate with coverslip format

Figure 4: Optimization of conditions for image acquisition. (A) Increasing the glycerol concentration increases TMR-dextran fluorescence, as determined in AsPC-1 cells treated with EGF. (B) Example coordinates of imaging beacons for automatic image acquisition when using the 24-well plate with coverslips format. The bar graph shows the average relative fluorescence with SEM of 5 experiments. Statistical significance was determined by two-way ANOVA, relative to PBS. ** p < 0.01; *** p < 0.001. Please click here to view a larger version of this figure.
- 96-well microplate format
- Start the plate reader and insert the microplate.
- Open the microplate reader and imaging software, create a new protocol by clicking on Protocols, and Create New. Double click on Procedure and select the plate type.
NOTE: If the plate type is not available, add the plate type to the software by clicking on System > Plate Types > Add Plate, and using the plate dimensions as provided by the manufacturer. For ease of use, the template for the CellCarrier-96 Ultra Microplates from PerkinElmer is provided in Supplementary File 2. - To access the imaging settings, select Actions > Image > Inverted Imager and click on OK. Use the 40x PL FL Phase objective with Wide FOV and Autofocus Binning.
- For the first channel, select the LED cube corresponding to the dextran fluorophore-label (GFP or RFP). Unclick Auto Exposure and click the microscope icon button to optimize exposure settings. When the appropriate exposure settings have been determined, click on Save Settings.
NOTE: During the optimization of the exposure settings, significant fluorescence bleaching can occur. This can result in settings that cause overexposure when a new field is imaged. Therefore, validate the exposure settings by checking a yet unexposed field and assuring that no saturation of the signal occurs at the selected settings. Do not include the wells used for the optimization of the exposure setting in the macropinosome quantification, as the fluorescence has decreased as a result of bleaching during the optimization. Adjust the exposure settings using a sample predicted to have the highest level of macropinocytosis to avoid overexposed images, which can result in saturation of the signal and loss of intensity data. - Repeat the previous step for the second channel using the DAPI LED cube.
- Set the autofocus settings for each fluorescence channel, select Focus Options. Unselect the default focus method and use Laser Autofocus. Capture a reference scan after determining the focal plane for optimal visualization of macropinosomes and nuclei. Click on OK to save the settings.
NOTE: The scan distance can be reduced to 400 µm and the increment to 3 µm to increase autofocus efficiency. For the laser autofocus option to work properly, clean the bottom of the plate, dry and wipe the plate with a lint-free wipe before imaging. The laser autofocus is a superior method for focus as it requires minimal time to find the focal plane. Other focus methods may be used, but, since no anti-fade has been added to the wells, these methods may cause significant bleaching of the samples which will negatively impact the collection of data. - Set the horizontal and vertical offset to zero and under Single Image select Montage with No Overlap and use 3 x 3 images, depending on how many cells are desired to be included in the analysis.
NOTE: Depending on the size and density of the cells, more or less images can be taken to obtain a representative assessment of macropinocytosis throughout the sample. Assessing macropinocytosis in AsPC-1 or MIA PaCa-2 cells under varying conditions, no differences in data interpretation between a 2 x 2 or 4 x 4 photo frame are observed, although variation between replicate samples may increase when taking less pictures (Figure 5A,B). Increasing or decreasing the size of the frame will affect the time it takes to scan the plate. Depending on the exposure time, a full 96-well microplate will take around 1-1.5 h to scan completely using a 3 x 3 frame. A 2 x 2 and 4 x 4 frame will halve or double that time, respectively. - To complete the adjustment of imaging settings, click on OK.
- To image the plate, select Create a New Experiment and Read Now from the Protocol Tools. Save the protocol and the experiment when prompted.

Figure 5: Control conditions for assessing macropinocytosis in PDAC cells. (A) AsPC-1 cells display macropinocytosis in response to 100 ng/mL EGF stimulation for 5 min or glutamine deprivation for 24 h. For image acquisition, picture frames of 4 x 4, 3 x 3, 2 x 3, or 2 x 2 were taken to determine the influence of the number of photos on data quality. (B) MIA PaCa-2 cells show constitutive macropinocytosis that is inhibited by 30-min treatment with 75 µM EIPA or 2-h treatment with 10 µM EHop-016. Picture frames were taken as in A. Scale bar = 25 µm. Bar graphs show the average relative macropinocytic index with SD of 1 experiment with 4 replicates. Statistical significance was determined by two-way ANOVA relative to the +Q or vehicle condition. *** p < 0.001 Please click here to view a larger version of this figure.
5. Determining the macropinocytic index
The 'macropinocytic index' is the extent of cellular macropinocytosis that is determined by quantifying fluorescent dextran uptake per cell using microscopic imaging19. To this end, the acquired images are used to determine the amount of internalized dextran by measuring the total fluorescence intensity or fluorescence-positive area and the total number of cells as determined by DAPI staining. This analysis can be performed with open-source image processing and analysis software, such as Cell Profiler or FIJI/ImageJ, as previously described19,20. However, when working with a multi-mode plate reader the software provided with the instrument may include built-in analysis applications that can be used for the purposes of computing the macropinocytic index. In some cases, the built-in software analysis pipeline may not be completely apparent to the user. It is therefore recommended to validate the software at an early stage by comparison with a non-automated procedure, such as Cell Profiler or FIJI/ImageJ. This protocol can be adapted to other image processing and analysis software tools by adhering to the following general instructions:
- For the DAPI and corresponding dextran image, subtract the background by applying the appropriate function, frequently called the rolling ball function. Adjust the settings so that the background noise is minimized and there is minimal to no subtraction effect on the DAPI and dextran signal.
- Using a field with high dextran signal, determine the intensity signal settings, frequently called the threshold function, to select the nuclei and determine the minimum intensity signal setting required to select only the macropinosomes.
- For the dextran image, calculate the total fluorescence within the created macropinosome selection or use the selection to determine the total area positive for dextran.
- For the DAPI image, use the selection to determine the number of nuclei in the image to reflect the number of cells present.
- To determine the macropinocytic index, divide the total dextran fluorescence or area by the number of cells determined by DAPI.
- Repeat these analysis steps for all the acquired images applying the same numerical settings throughout.
- Follow these instructions for determining the macropinocytic index when using Gen5 software:
NOTE: The built-in analysis pipeline was validated and detected no differences in computation relative to Fiji/ImageJ (Figure 6A).- After the imaging is completed, select an image with a high level of macropinocytosis. Remove the background signal, click Process (Supplementary Figure 1A) and select the Image Preprocessing option.
- For the dextran channel, deselect Auto and use a rolling ball diameter of 5 µm, prioritize fine results and smooth the image with 1 cycle.
- For the DAPI channel, use Auto preprocessing and 1 smooth cycle. Click on OK and add the image preprocessing step to the protocol; click ADD STEP. Next, select the processed image under the Image roll-out (Supplementary Figure 1B) and click the Analyze button (Supplementary Figure 1C).
- Under ANALYSIS SETTINGS, set the Type to Cellular Analysis. Select the DAPI channel and click on Options (Supplementary Figure 2A).
- For the primary mask, using the processed DAPI image, create a mask to select single nuclei. Use the dark background and Auto option. Additionally, determine which settings allow for mask selection of single nuclei and when finished, click on the Apply button to determine if the mask is applied appropriately.
NOTE: Activating the Split Touching Objects and Fill Holes in Masks options may work best for selecting single nuclei. Minimum and maximum object sizes may need to be adjusted depending on the cell line and are most commonly set in the 5-40 µm range. Primary Edge Objects can be included, and the entire image should be analyzed. The slider can be applied to adjust the mask selection to the signal intensity. - Next, apply a secondary mask to optimize the settings for selecting the macropinosome fluorescent puncta. Use the Measure within a Secondary Mask function and expand the primary mask by 40 µm depending on the size of the cells.
- Use the Threshold function and Threshold in Mask method to select the positive dextran areas. Click on Apply to determine whether the settings are applied correctly.
NOTE: To determine the threshold value, use the View Line Profile tool (Supplementary Figure 2B) and draw a line over a dextran-positive area (Supplementary Figure 2C). Use the measured intensity to determine the best setting to create a mask that selects macropinosomes and excludes background signal (Supplementary Figure 2D). - After creating appropriate masks to select nuclei and macropinosomes, click on the Calculated Metrics tab and select Select or Create Object-Level Metrics of Interest.
- Remove all metrics present and add the Integral and Area metrics for analysis of the secondary mask. Click on OK and select Calculate and Show for the new metrics. When finished, click on OK and select ADD STEP to add the analysis and calculations to the protocol.
- Save the finalized protocol for future use, click File and Save Protocol As.
- After the data analysis has finished, select the metrics of interest and export the data to determine the macropinocytic index. Determine the macropinocytic index as follows:
Dextran fluorescence per cell = Object Int_2[Dextran fluorophore]
Dextran area per cell = Object Area_2[Dextran fluorophore]
NOTE: For the 24-well plate with coverslips format, the metrics reflect the mean of the average macropinocytic index per image. Alternatively, the macropinocytic index can be calculated manually for the entire sample by dividing the sum of the 'Area' or 'Integral' for all images by the total 'Cell Count'. The difference between these approaches in calculating the macropinocytic index is minimal in most settings. For the 96-well microplate format, the macropinocytic index is calculated as the average for the entire sample. - Save the protocol for imaging and the subsequent automated analysis. Reuse the protocol for future experiments with the same fluorophores.
NOTE: When using the laser autofocus function, a new reference scan must be taken when a different cell line is to be analyzed since nuclei and macropinosomes are possibly localized to a different plane. Each time a new experiment is performed using a previously determined protocol, the exposure settings for that experiment must be optimized.
6. Addition of treatments
Cell treatments (small molecules, biologics, growth factors, metabolites etc.) can be incorporated at any stage of the protocol, and the precise timing will depend on the goals and aims of the study.
- Prepare the cells as in section 2.
- Just before adding the treatments of interest, prepare the treatments and the appropriate controls at twice their final concentrations in serum-free media. Prepare the treatments in a volume equal to the volume of the number of replicate wells being assessed.
NOTE: Given the role that secreted factors can play in controlling cellular functions, it may be preferred to dilute the treatments of interest in conditioned media. For these purposes, it may be helpful to seed additional plates, such as 6-cm or 10-cm cell culture dishes, when preparing cells as described in section 2 to generate the conditioned media for the preparation of the treatment solutions. - Without removing the media from the well, add one well-volume of treatment solution to each well. Shake the plate to ensure proper mixing. Incubate the cells for the desired amount of time.
- Continue with section 3.
NOTE: When adding the dextran, the use of fresh media causes the removal of the added treatments, which may affect the level of macropinocytosis. Therefore, it may be preferred to add dextran directly to the wells without aspirating or alternatively re-adding the treatments or reusing the conditioned media to prepare the dextran solution.

Figure 6: Performing a dose-response curve for macropinocytosis inhibitors. Example data obtained when testing known macropinocytosis inhibitors in a new cell line. PATU8998T cells were used for the 96-well microplate format and treated for 2 h and 30 min with the indicated concentrations of (A) EHop-16 and (B) EIPA, respectively. Comparison of results obtained through image analysis by the Gen5 software or ImageJ shows no significant differences between the two approaches as indicated by ns in (A). Scale bar = 25 µm. Bar graphs show the average and SD of a single experiment with 4 replicates. Statistical significance was determined by one- or two-way ANOVA, compared to untreated conditions. * p < 0.05; *** p < 0.001. Please click here to view a larger version of this figure.
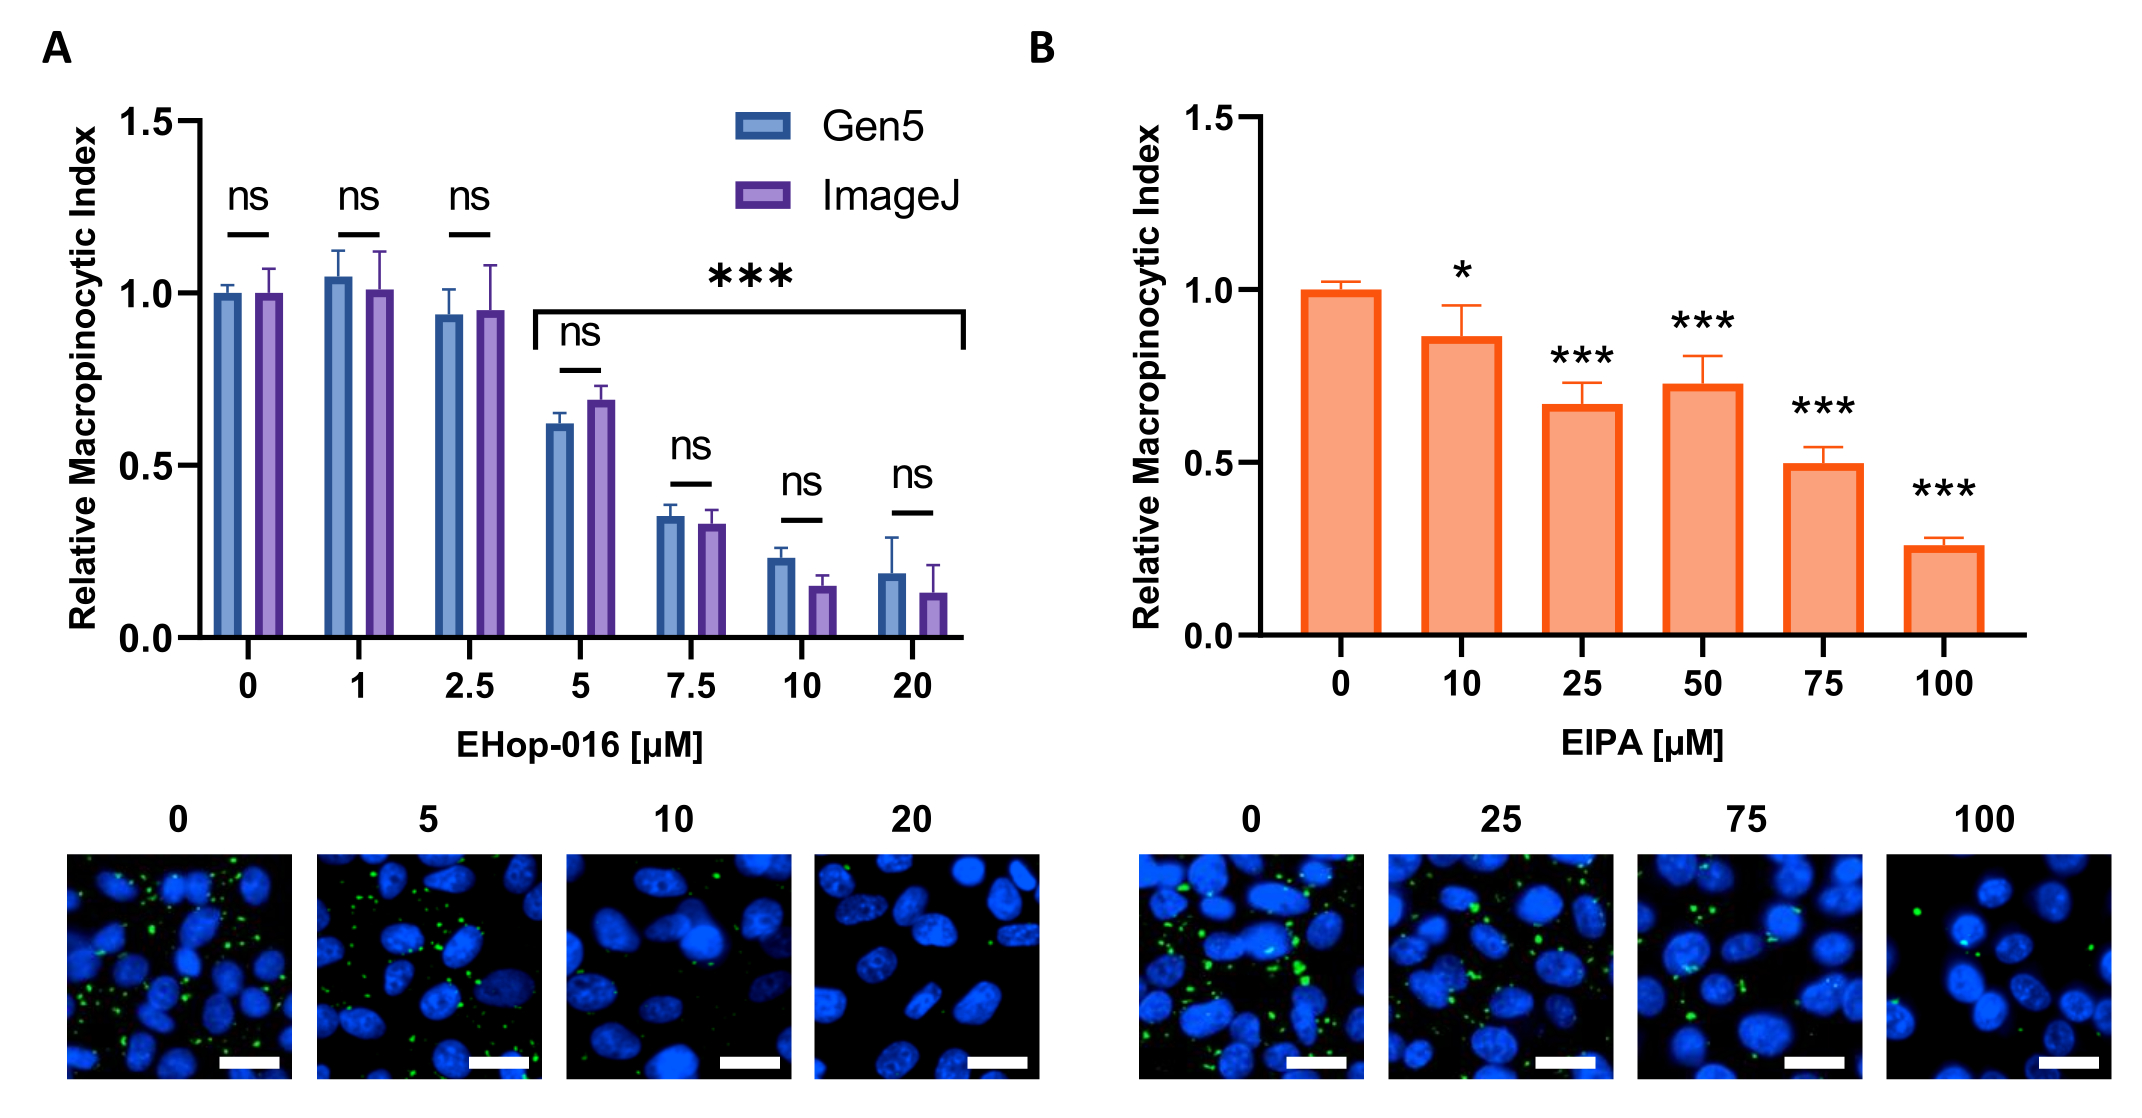
Results
When the steps and adjustment of the above-described protocol are followed accordingly, the final experimental results should provide information about whether the studied cell culture conditions or inhibitors induce or reduce macropinocytosis in the cell line of interest. To strengthen the validity of these findings, the inclusion of control conditions will allow for the scrutinization of the results to determine whether the experiment has been completed successfully. Macropinocytosis induction controls will provide inf...
Discussion
The quality of the experiments and data acquisition highly depends on the quality of the reagents, the optimization of the settings, and the cleanliness of the coverslips and microplate. The final results should give minimal variation between replicates; however, biological variations do naturally occur or may otherwise be caused by a number of factors. Cell density may cause cells to respond more or less to macropinocytosis inducers or inhibitors. It is, therefore, crucial to adhere to the 80% confluency as proposed her...
Disclosures
C.C. is an inventor on an issued patent titled ''Cancer diagnostics, therapeutics, and drug discovery associated with macropinocytosis,'' Patent No.: 9,983,194.
Acknowledgements
This work was supported by NIH/NCI grants (R01CA207189, R21CA243701) to C.C. KMO.G. is a recipient of a TRDRP Postdoctoral Fellowship Award (T30FT0952). The BioTek Cytation 5 is a part of the Sanford Burnham Prebys Cell Imaging Core, which receives financial support from the NCI Cancer Center Support Grant (P30 CA030199). Figures 1-3 were created using BioRender.
Materials
| Name | Company | Catalog Number | Comments |
| 0.25% Trypsin | Corning | 25053CI | 0.1% EDTA in HBSS w/o Calcium, Magnesium and Sodium Bicarbonate |
| 1.5 mL Microcentrifuge tube | Fisherbrand | 05-408-129 | |
| 10-cm Tissue culture dish | Greiner Bio-One | 664160 | CELLSTAR |
| 15 mL Centrifuge tube | Fisherbrand | 07-200-886 | |
| 2 L Beaker | Fisherbrand | 02-591-33 | |
| 24-well Tissue culture plate | Greiner Bio-One | 662160 | CELLSTAR |
| 25 mL Reagent reservoir | Genesee Scientific Corporation | 28-121 | |
| 500 mL Beaker | Fisherbrand | 02-591-30 | |
| 6-cm Tissue culture dish | Greiner Bio-One | 628160 | CELLSTAR |
| 8-Channel aspiration adapter | Integra Biosciences | 155503 | |
| 8-Channel aspiration adapter for standard tips | Integra Biosciences | 159024 | |
| 95% Ethanol | Decon Laboratories Inc | 4355226 | |
| Ammonia-free glass cleaner | Sparkle | FUN20500CT | |
| Black 96-well high-content screening microplate | PerkinElmer | 6055300 | CellCarrier-96 Ultra |
| Cotton-tipped applicator | Fisherbrand | 23-400-101 | |
| Coverslips | Fisherbrand | 12-545-80 | 12 mm diameter |
| Cytation 5 Cell Imaging Multi-Mode Reader | Biotek | CYT5FW | |
| DAPI | Millipore Sigma | 5.08741 | |
| Dextran 70 kDa - FITC | Life Technologies | D1822 | Lysine-fixable |
| Dextran 70 kDa - TMR | Life Technologies | D1819 | |
| DMSO | Millipore Sigma | D1435 | |
| DPBS | Corning | 21031CV | Without Calcium and Magnesium |
| Forceps | Fine Science Tools | 11251-20 | Dumont #5 |
| Formaldehyde, 37% | Ricca Chemical | RSOF0010-250A | ACS Reagent Grade |
| Glycerol | Fisher BioReagents | BP229-1 | |
| Hardening fluorescence mounting media | Agilent Tech | S302380-2 | DAKO |
| Hoechst 33342 | Millipore Sigma | B2261 | |
| Hydrochloric acid (HCl) | Fisher Chemical | A144-212 | Certified ACS Plus, 36.5%–38.0% |
| Lint-free wipes | Kimberly-Clark | 34155 | Kimwipes |
| Miscroscope slides | Fisherbrand | 12-544-1 | Premium plain glass |
| Multichannel pipette | Gilson | FA10013 | 8 channels, 0.5–10 µL |
| Multichannel pipette | Gilson | FA10012 | 12 channels, 20–200 µL |
| Multichannel pipette | Gilson | FA10011 | 8 channels, 20–200 µL |
| Parafilm M | Pechiney | PM996 | |
| Plastic wrap | Kirkland Signature | 208733 | Stretch-Tite |
| Silicone isolators | Grace Bio Labs Inc | 664107 | 13 mm Diameter X 0.8 mm Depth ID, 25 mm X 25 mm |
| Slide adapter | Biotek | 1220548 | |
| Wash bottle | Fisherbrand | FB0340922C |
References
- Lin, X. P., Mintern, J. D., Gleeson, P. A. Macropinocytosis in different cell types: similarities and differences. Membranes. 10 (8), 21 (2020).
- Recouvreux, M. V., Commisso, C. Macropinocytosis: a metabolic adaptation to nutrient stress in cancer. Frontiers in Endocrinology. 8, (2017).
- Zhang, Y. J., Commisso, C. Macropinocytosis in cancer: a complex signaling network. Trends in Cancer. 5 (6), 332-334 (2019).
- Commisso, C., et al. Macropinocytosis of protein is an amino acid supply route in Ras-transformed cells. Nature. 497 (7451), 633-637 (2013).
- Kim, S. M., et al. PTEN deficiency and AMPK activation promote nutrient scavenging and anabolism in prostate cancer cells. Cancer Discovery. 8 (7), 866-883 (2018).
- Jayashankar, V., Edinger, A. L. Macropinocytosis confers resistance to therapies targeting cancer anabolism. Nature Communications. 11 (1), (2020).
- Kamphorst, J. J., et al. Human pancreatic cancer tumors are nutrient poor and tumor cells actively scavenge extracellular protein. Cancer Research. 75 (3), 544-553 (2015).
- Olivares, O., et al. Collagen-derived proline promotes pancreatic ductal adenocarcinoma cell survival under nutrient limited conditions. Nature Communications. 8, (2017).
- Seguin, L., et al. Galectin-3, a druggable vulnerability for KRAS-addicted cancers. Cancer Discovery. 7 (12), 1464-1479 (2017).
- Redelman-Sidi, G., et al. The canonical Wnt pathway drives macropinocytosis in cancer. Cancer Research. 78 (16), 4658-4670 (2018).
- Tejeda-Munoz, N., Albrecht, L. V., Bui, M. H., De Robertis, E. M. Wnt canonical pathway activates macropinocytosis and lysosomal degradation of extracellular proteins. Proceedings of the National Academy of Sciences of the United States of America. 116 (21), 10402-10411 (2019).
- Schmees, C., et al. Macropinocytosis of the PDGF beta-receptor promotes fibroblast transformation by H-RasG12V. Molecular Biology of the Cell. 23 (13), 2571-2582 (2012).
- Lee, S. -. W., et al. EGFR-Pak signaling selectively regulates glutamine deprivation-induced macropinocytosis. Developmental Cell. 50 (3), 381-392 (2019).
- Recouvreux, M. V., et al. Glutamine depletion regulates Slug to promote EMT and metastasis in pancreatic cancer. Journal of Experimental Medicine. 217 (9), (2020).
- Zhang, Y., et al. Macropinocytosis in cancer-associated fibroblasts is dependent on CaMKK2/ARHGEF2 signaling and functions to support tumor and stromal cell fitness. Cancer Discovery. 11 (7), 1808-1825 (2021).
- Su, H., et al. Cancer cells escape autophagy inhibition via NRF2-induced macropinocytosis. Cancer Cell. 39 (5), 678-693 (2021).
- Bar-Sagi, D., Feramisco, J. R. Induction of membrane ruffling and fluid-phase pinocytosis in quiescent fibroblasts by ras proteins. Science. 233 (4768), 1061-1068 (1986).
- Mishra, R., et al. Stromal epigenetic alterations drive metabolic and neuroendocrine prostate cancer reprogramming. Journal of Clinical Investigation. 128 (10), 4472-4484 (2018).
- Commisso, C., Flinn, R. J., Bar-Sagi, D. Determining the macropinocytic index of cells through a quantitative image-based assay. Nature Protocols. 9 (1), 182-192 (2014).
- Galenkamp, K. M. O., Alas, B., Commisso, C. Quantitation of macropinocytosis in cancer cells. Methods in Molecular Biology. 1928, 113-123 (2019).
- Wang, J. T. H., Teasdale, R. D., Liebl, D. Macropinosome quantitation assay. MethodsX. 1, 36-41 (2014).
- Lee, S. -. W., Alas, B., Commisso, C. Detection and quantification of macropinosomes in pancreatic tumors. Methods in Molecular Biology. 1882, 171-181 (2019).
- Williams, T., Kay, R. R. High-throughput measurement of dictyostelium discoideum macropinocytosis by flow cytometry. Journal of Visualized Experiments: JoVE. (139), e58434 (2018).
Reprints and Permissions
Request permission to reuse the text or figures of this JoVE article
Request PermissionThis article has been published
Video Coming Soon
Copyright © 2025 MyJoVE Corporation. All rights reserved