
A subscription to JoVE is required to view this content. Sign in or start your free trial.
Method Article
Optimized Automated Analysis of Live Neuronal Mitochondria Homeostasis Modulation by Isoform-Specific Retinoic Acid Receptors
In This Article
Summary
The mitochondrial network is extremely complex, making it very challenging to analyze. A novel MATLAB tool analyzes live confocal imaged mitochondria in timelapse images but results in a large output volume requiring individual manual attention. To address this issue, a routine optimization was developed, allowing for speedy file analysis.
Abstract
The complex mitochondrial network makes it very challenging to segment, follow, and analyze live cells. MATLAB tools allow the analysis of mitochondria in timelapse files, considerably simplifying and speeding up the process of image processing. Nonetheless, existing tools produce a large output volume, requiring individual manual attention, and basic experimental setups have an output of thousands of files, each requiring extensive and time-consuming handling.
To address these issues, a routine optimization was developed, in both MATLAB code and live-script forms, allowing for swift file analysis and significantly reducing document reading and data processing. With a speed of 100 files/min, the optimization allows an overall rapid analysis. The optimization achieves the results output by averaging frame-specific data for individual mitochondria throughout time frames, analyzing data in a defined manner, consistent with those output from existing tools. Live confocal imaging was performed using the dye tetramethylrhodamine methyl ester, and the routine optimization was validated by treating neuronal cells with retinoic acid receptor (RAR) agonists, whose effects on neuronal mitochondria are established in the literature. The results were consistent with the literature and allowed further characterization of mitochondrial network behavior in response to isoform-specific RAR modulation.
This new methodology allowed rapid and validated characterization of whole-neuron mitochondria network, but it also allows for differentiation between axon and cell body mitochondria, an essential feature to apply in the neuroscience field. Moreover, this protocol can be applied to experiments using fast-acting treatments, allowing the imaging of the same cells before and after treatments, transcending the field of neuroscience.
Introduction
Cellular mitochondria sit at the center of all physiological states, and a thorough understanding of their homeostasis (mitostasis) and behavior is paramount to assist in identifying pharmacological treatment for a wide range of illnesses, including cancer and Alzheimer's disease1,2.
Mitochondria play crucial cellular roles in energy homeostasis, ATP generation, calcium buffering, and ROS regulation, and mitostasis is essential for maintaining protein homeostasis as molecular chaperones are energy-dependent3. These require a constant and dynamic network modulation and adaptation to efficiently meet cellular needs, and mitochondria transport is regulated by different signaling pathways; previous work has described one such pathway, that of retinoic acid receptors (RARs)4,5. Retinoic acid (RA) promotes axonal and neurite outgrowth via RAR activation. In mouse primary cortical neurons, activation of RAR-β encourages mitochondrial growth, speed, and mobility in the neurite6.
Considering the mitochondrial network adaptability and dynamics, the possibility of assessing mitostasis in "real time" is essential not only for investigating energy homeostasis, but also for proteostasis, cellular health, proliferation, or signaling. A commonly used method for evaluating mitostasis relies on confocal microscopy after highlighting mitochondria using a fluorescent dye or marker, as well as a specific microscopy setup allowing temperature and/or CO2 regulation7. This type of experimental setup entails that one experimental replicate be performed at a time. In addition to experimental repetition of different treatments, it should be considered that most experiments should have their technical replicates (where more than one position is imaged per plate), with a series of focal planes (z-stacks) being recorded in a series of time points. Thus, an experimental design with three repetitions of one control and two treatments, with five imaging positions per plate, and 15 time points, results in 225 stacks to be processed. Classically, videos of live mitochondria were analyzed by plotting kymographs, which would be individually analyzed8, in a time-consuming process requiring extensive manual input, even when relying on computer tools.
An algorithm was recently described9 that allows automated segmentation and tracking of mitochondria in live-cell 2-D and 3-D time-lapse files. Other quantification techniques are available, and all have their limitations10. Mitometer, an automated open-source application, is particularly adequate for time lapse and mitochondria dynamics analysis, requiring low user input. This application has a series of advantages over other existing MATLAB-based tools, namely allowing the automatic processing of individual TIF stacks, using up to 13 different parameters, particularly interesting for neurosciences, as it differentiates between peri- and tele-nuclear mitochondria.
However, for an experiment such as the above described, these 13 parameters applied to 225 stacks result in 2,925 individual output files. These require four individual computer inputs, which sum up to over 10,000 manual inputs being required to download all output files. For large experimental designs, this results in a needlessly extremely time-consuming analysis of each file and data integration. Herein we present a routine optimization that allows swift file analysis, greatly reducing document reading and data processing, analyzing data in a defined manner, consistent with the output from existing tools.
Access restricted. Please log in or start a trial to view this content.
Protocol
NOTE: This protocol has two main steps: a wet lab step, involving cell culture and live confocal microscopy to obtain images of live mitochondria (Figure 1) and an in silico step to analyze obtained images (Figure 2). For automated data analysis of 3D live imaged mitochondria, the MATLAB application Mitometer was used as provided by Lefebvre et al.9. The Routine optimization is written in MATLAB. The software, updated versions and processing ImageJ Macros are freely available online through GitHub, at https://github.com/JoseJoaoMV/Routine_Optimization_Mitometer_APP_MATLAB.
1. Live microscopy

Figure 1: Experimental protocol. SH-SY5Y cells were differentiated and treated with retinoids. (A) TMRM was used to live image healthy mitochondria in treated cells using a confocal microscope, capturing a time lapse z-stack of five visual fields. (B) Mitometer application MATLAB automatically segments and analyzes mitochondria images. In addition to analyzing, this software automatically discriminates mitochondria according to nuclear proximity. Blue dots are mitochondrial initial positions; red dots are final positions. Scale bar = 30 µm. Abbreviation: TMRM = tetramethylrhodamine, methyl ester. Please click here to view a larger version of this figure.
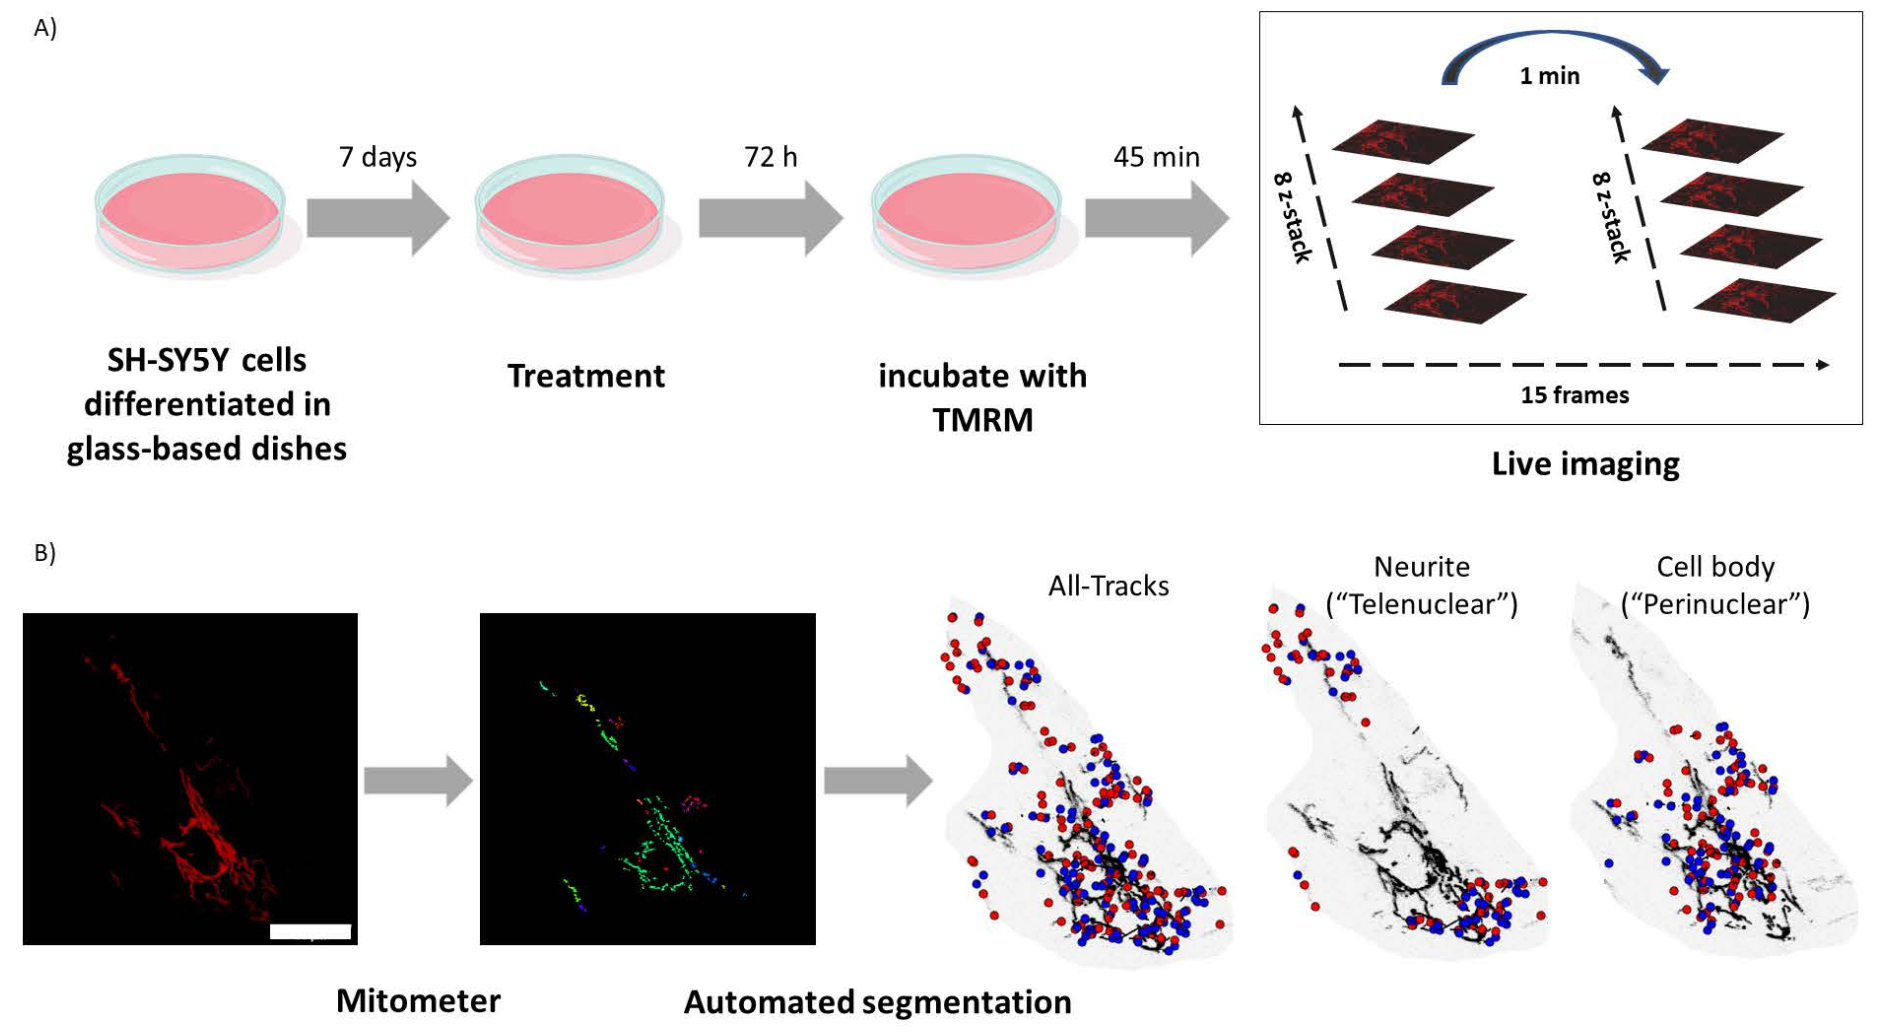
- Cell culture
- Incubate SH-SY5Y cells at 37 °C in a humidified atmosphere of 5% CO2 and 95% air, cultured in equal parts of MEM (Minimal Essential Medium) and F12 (Ham's F12 Nutrient Mix) Medium, supplemented with 10% fetal bovine serum (FBS).
- Plate SH-SY5Y cells in glass-bottom cell dishes at a density of 15 × 104 cells/mL.
- Differentiate cells with 5 days of treatment with 10 µM all-trans retinoic acid in 1% FBS-containing culture medium, followed by 2 days of treatment with 10 ƞg/mL brain-derived neurotrophic factor (BDNF).
- Cell treatment
- Wash cells with sterile phosphate-buffered saline (PBS) and treat for 72 h with 10-7 M RAR-isoform agonists, in equal parts of MEM (Minimal Essential Medium) and F12 (Ham's F12 Nutrient Mix) Medium, supplemented with 1% FBS.
NOTE: The RARα agonist used was AM580; RARβ agonist used was CD2314; Ch55 was used as agonist as RARα and β co-agonist; atRA was used as a positive control; BMS493 was used as a RAR pan-antagonist.
- Wash cells with sterile phosphate-buffered saline (PBS) and treat for 72 h with 10-7 M RAR-isoform agonists, in equal parts of MEM (Minimal Essential Medium) and F12 (Ham's F12 Nutrient Mix) Medium, supplemented with 1% FBS.
- Live confocal imaging
- Replace culture medium with fresh 1% FBS-containing culture medium with 20 nM tetramethylrhodamine, methyl ester (TMRM) for 45 min.
NOTE: TMRM is a cell-permeant fluorescent dye, sequestered by active mitochondria, and this incubation period allows TMRM to reach an equilibrium and be taken up by polarized mitochondria11. Imaging should be started before equilibrium is established as TMRM signal intensity could artificially increase during imaging. - Place the cells in an incubator attached to a laser-scanning confocal microscope at 37 °C.
- Capture images using a 63x oil-immersion apochromat objective, with an image size of 512 x 512 pixels obtained with a pinhole aperture of 1 airy unit, capturing a time series of 15 frames from five different visual fields in each cell plate, and a z-stack of 8 equidistant z-planes. The resulting .lsm file is a time-, position-, and z-stack.
NOTE: Settings for gain, contrast, and brightness must be initially optimized using the minimum laser power necessary to use the entire dynamic range of the detector and kept constant throughout the study, ensuring that all imaging is performed under the same conditions. Up to nine different positions can be recorded in this hardware-software combination and the microscope cycles between imaging positions automatically.
- Replace culture medium with fresh 1% FBS-containing culture medium with 20 nM tetramethylrhodamine, methyl ester (TMRM) for 45 min.
2. Image analysis

Figure 2: Routine optimization. (A) Representative code of the routine optimization. (B) Routine optimization Live-Script. (C) Routine optimization workflow. (D) Routine optimization result validation: representative image of mitochondria in untreated cells (left panel), treated with atRA (10-7 M, 72 h, middle panel), and treated with RAR antagonist BMS493 (10-7 M, 72 h, right panel), imaged after incubation with TMRM (20 nM, 45 min incubation). Scale bar = 30 µm. (E) TMRM Intensity in cell body mitochondria. Significant decrease with all-trans retinoic acid treatment (atRA, 10-7 M, 72 h), compared with control (p=0,0062), not observed when treated with RAR antagonist (BMS493, 10-7 M, 72 hours). Five cells were quantified from each of three repetitions per condition. Please click here to view a larger version of this figure.
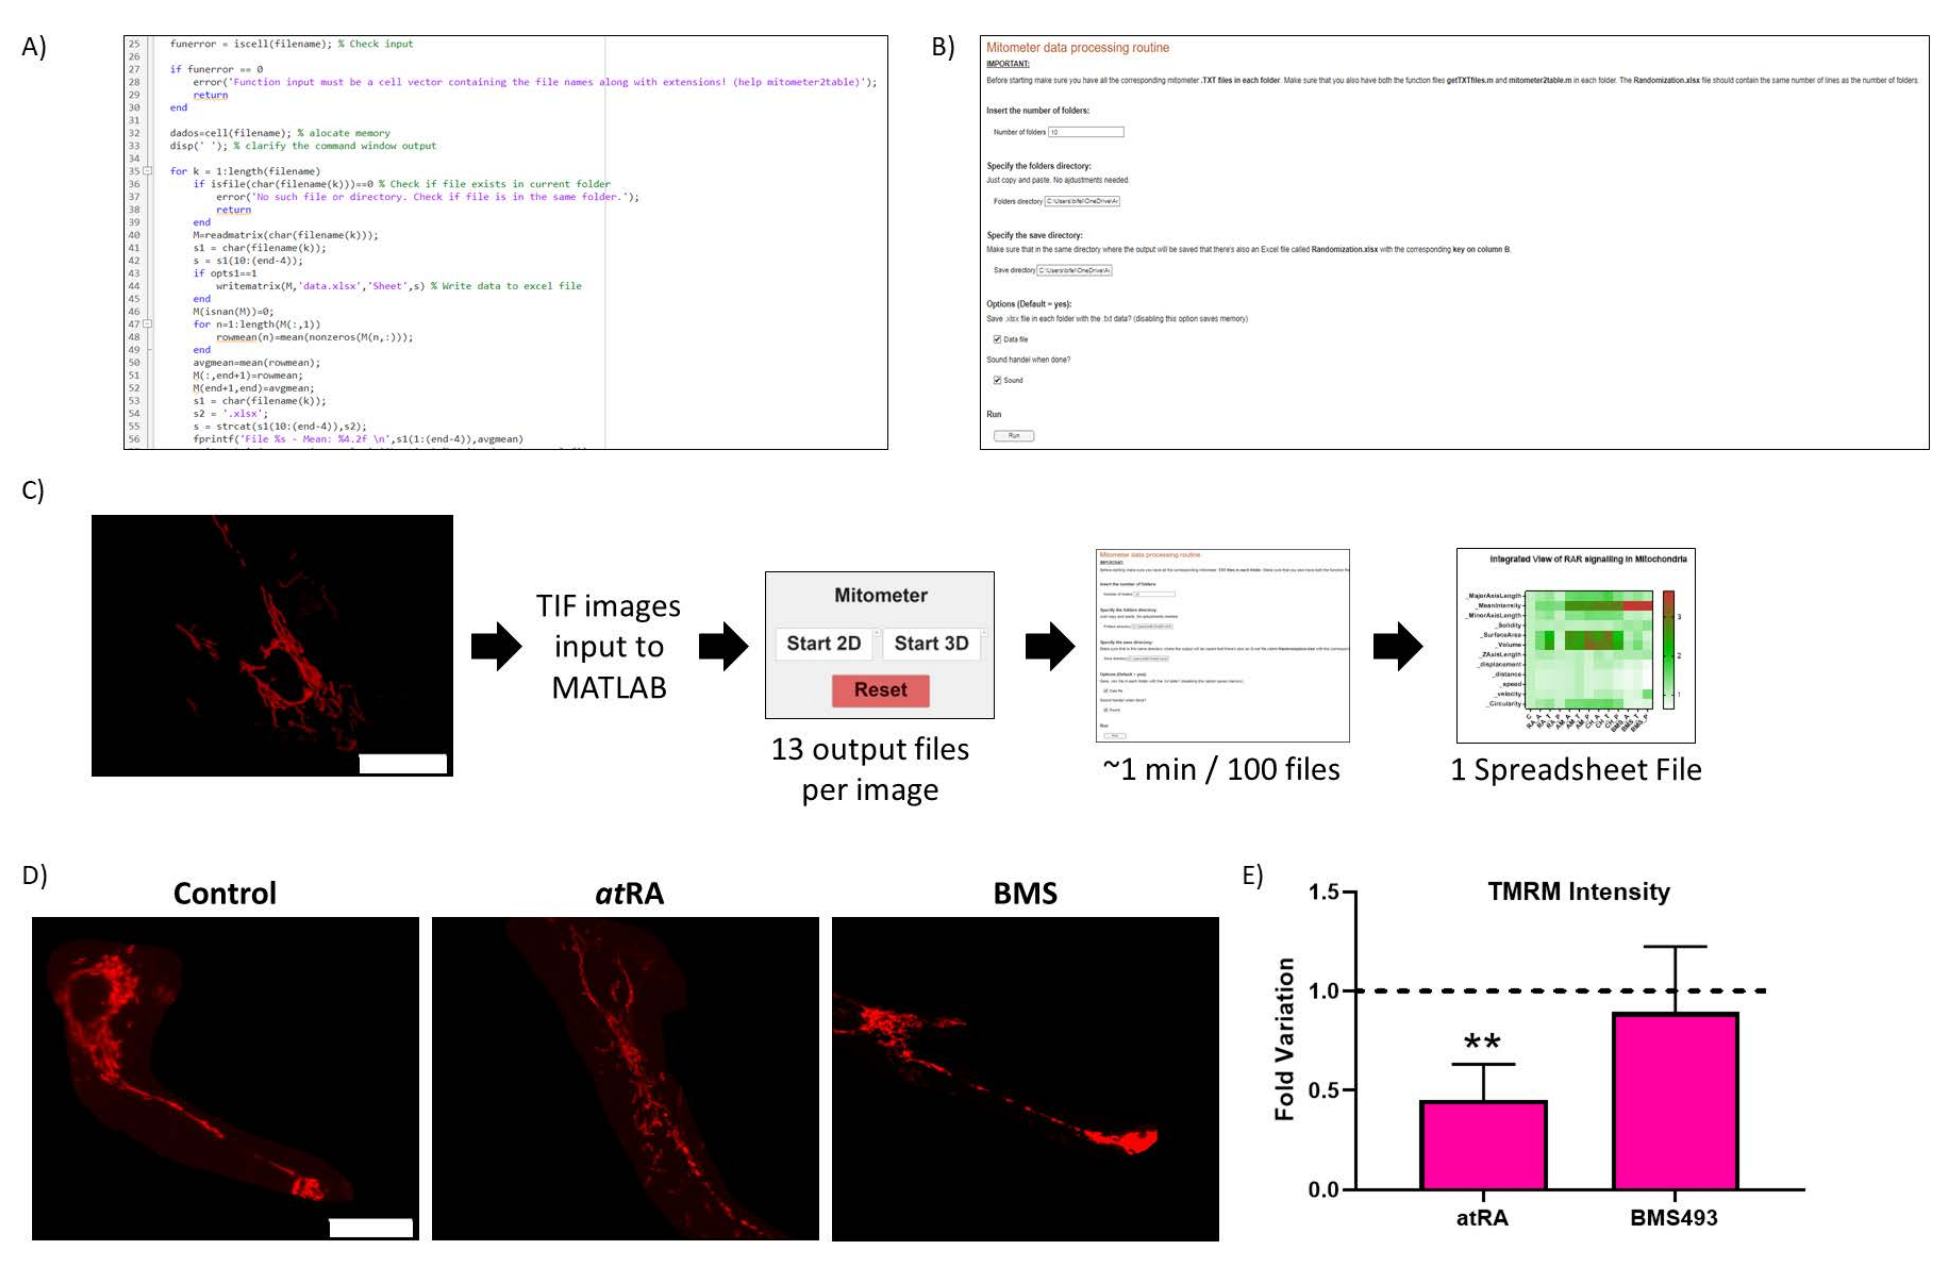
- Image processing
- Open files in ImageJ 2.1.0 and separate position stacks by visual field: Open ImageJ and click Menu Bar | Image | Duplicate | Input slices/frame number | OK.
NOTE: To decrease repetitive inputs to the software, an ImageJ Macro was developed to facilitate duplication and saving of visual field images.
- Open files in ImageJ 2.1.0 and separate position stacks by visual field: Open ImageJ and click Menu Bar | Image | Duplicate | Input slices/frame number | OK.
- Macro protocol
- Draw a region of interest (ROI) around the cell with the free selection tool.
- Run the macro by opening ImageJ and navigating to Menu Bar | Plugins | Macros | Run Clear the background and save images macro.
NOTE: Images can be randomized in this process, storing the solution key according to optimization requirements. - Determine pixel size and voxel-depth: Open ImageJ | the Image and navigate to Menu Bar | Image | Properties.
- Alternative direct protocol
NOTE: This alternative does not use Macro to process images- Find the pixel size and voxel depth: Open ImageJ | Open Image and navigate to Menu Bar | Image | Properties.
- Draw an ROI around the cell with the free selection tool, ensuring it encompasses the whole cell throughout the 15 frames.
- Navigate to Menu Bar | Edit | Clear Outside.
- Navigate to Menu Bar | File | Save-as | Select Tiff.
- Select Saving Folder and click on Save.
NOTE: Images can be blinded/randomized manually at this point before continuing to analysis.
- Automated image analysis
- Prepare the folders for analysis files.
- Create three main folders, titled "All tracks", "Perinuclear tracks", and "Telenuclear tracks".
NOTE: These match the main automated track options. - In each main folder, create a sub-folder for each image to process, identified numerically from 1 upwards.
- Add a copy of the two routine optimization supplementary files (mitometer2table.m and getTXTfiles.m) to each image folder.
NOTE: These files help in data analysis and final format arrangement. The number of folders must match the number of elements in the randomized spreadsheet (.xlsx). After creating all numbered subfolders with supplementary files for one dataset, they can be batch-copied and pasted to the remaining datasets.
- Create three main folders, titled "All tracks", "Perinuclear tracks", and "Telenuclear tracks".
- Prepare the folders for analysis files.
- Use the MATLAB application Mitometer to analyze images.
NOTE: This protocol was run on a mitometer, installed on MATLAB R2022a. Load images in batches of 30 for optimal time-running and output balance. Maximum MAT-file size is imposed by the native file system: by default, "save" operations can create a file < 231 bytes (~2 GB); save format MAT-Files Version 7.3 can be used instead, as it allows maximum variable sizes larger than 2 GB.- Identify/alter the default MAT-file version: On the Home tab in the Environment section, click Preferences and select MATLAB | General | MAT-Files.
- Use MATLAB tool Mitometer to analyze: Open MATLAB and navigate to Menu Bar | APPS | Open Mitometer | Select Start 3D | Input data (Pixel Size (µm): 0.1395089/Time between frames (s): 2/Number z-planes: 8/Axial distance between z-planes (µm): 0.418809 | Select images to input.
- Go to Mitometer Side Menu, select Image, click on Select Highlighted, navigate to the mitometer Menu Bar | Select Tracks | Track views | select All-Tracks, Telenuclear or Perinuclear | mitometer Menu Bar | Select Analysis | Choose an element (i.e., Length) | select Save to ".txt".
NOTE: More than one parameter can be downloaded at once, if selected concomitantly. - Extract result files to the created folders (2.2.1).
- Routine optimization and data analysis
- Prepare/adapt the "Randomization.xlsx" file containing the key for image encoding.
- Insert a list of consecutive integers, from 1 upwards, in column A.
NOTE: It is advisable to keep a duplicated folder with originally named images. - Place the analytic variables in column B, composed of alphanumeric characters.
NOTE: The number of lines in the document must be consistent with the number of folders present in the main dataset. Copy and paste this "Randomization.xlsx" file into the other two main datasets.
- Insert a list of consecutive integers, from 1 upwards, in column A.
- Optimized data analysis
- Double-click "executable.mlx", input the number of folders, specify the folders directory (copy the directory from the top of the folder) | the save directory (copy the directory from the top of the folder) | the spreadsheet name in the output file and click Run.
- Perform statistical analysis as necessary.
NOTE: Optional creation of a .xlsx file in each folder with the .txt data and sound alert to the end of analysis may be selected. Live Script outputs a single spreadsheet file in a table format. In this output, columns represent analyzed parameters (e.g., "Major Axis Length"; "Intensity") and lines represent visual fields of analytic variables (e.g., "Control").
- Prepare/adapt the "Randomization.xlsx" file containing the key for image encoding.
Access restricted. Please log in or start a trial to view this content.
Results
To enhance and accelerate the analysis of output files in .txt format, a routine optimization was coded that reads data consistent with Mitometer .txt output files, with columns representing a frame and lines representing identified mitochondria. The routine optimization produces data in a single value per parameter by averaging the frames for each identified mitochondria and then averaging the results of all mitochondria per visual field. The developed routine reads files from folders numbered from 1 upwards. The Live S...
Access restricted. Please log in or start a trial to view this content.
Discussion
Live cell imaging produces large files that require serious computing processing, but even the most recent tools require extensive manual input to process. This routine optimization is focused on simplifying the process of mitochondria analysis on the Mitometer because this tool presents a very good balance between user input and data output. A comprehensive comparison between different tools for mitochondria image analysis has previously been reviewed10. While other pipelines are more focused on ...
Access restricted. Please log in or start a trial to view this content.
Disclosures
The authors have no conflicts of interest to declare.
Acknowledgements
Image acquisition was performed in the LiM facility of iBiMED, a node of PPBI (Portuguese Platform of BioImaging): POCI-01-0145-FEDER-022122. This work was supported by FCT (EXPL/BTM-SAL/0902/2021) LCF (CI21-00276), a grant to DT from the Fundação para a Ciência e Tecnologia of the Ministério da Educação e Ciência (2020.02006.CEECIND), a grant from ATG-The Gabba Alumni Association to VP, and the Institute for Biomedicine-iBiMED, University of Aveiro.
Access restricted. Please log in or start a trial to view this content.
Materials
| Name | Company | Catalog Number | Comments |
| AM580 | Sigma-Aldrich | A8843 | |
| BDNF | Thermo-Fisher | RP8642 | |
| BMS493 | Tocris Bioscience | 3409 | |
| CD2314 | Tocris Bioscience | 3824 | |
| Ch55 | Tocris Bioscience | 2020 | |
| Foetal Bovine Serum | Thermo-Fisher | 10270106 | |
| GraphPad Prism v4.0 | GraphPad Software, La Jolla | n/a | |
| Ham’s F12 Nutrient Mix | Thermo-Fisher | 21765029 | |
| MATLAB R2022a | MathWorks | n/a | |
| Minimal Essential Medium | Thermo-Fisher | 31095 | |
| Nunc Glass Bottom Dishes | Thermo-Fisher | 150680 | |
| Phosphate Buffer Saline Solution | Thermo-Fisher | 28372 | |
| Retinoic acid | Sigma-Aldrich | R2625 | |
| TMRM | Thermo-Fisher | T668 | |
| Zeiss LSM 510 | Carl Zeiss | n/a | Equiped with live-cell imaging culture chamber and 63x oil immersion objective |
References
- Trigo, D., Avelar, C., Fernandes, M., Sa, J., da Cruz, E. S. O. Mitochondria, energy, and metabolism in neuronal health and disease. FEBS Letters. 596 (9), 1095-1110 (2022).
- Zong, W. X., Rabinowitz, J. D., White, E. Mitochondria and cancer. Molecular Cell. 61 (5), 667-676 (2016).
- Clare, D. K., Saibil, H. R. ATP-driven molecular chaperone machines. Biopolymers. 99 (11), 846-859 (2013).
- Tourniaire, F., et al. All-trans retinoic acid induces oxidative phosphorylation and mitochondria biogenesis in adipocytes. Journal of Lipid Research. 56 (6), 1100-1109 (2015).
- Psarra, A. M., Sekeris, C. E. Nuclear receptors and other nuclear transcription factors in mitochondria: regulatory molecules in a new environment. Biochimica et Biophysica Acta. 1783 (1), 1-11 (2008).
- Trigo, D., Goncalves, M. B., Corcoran, J. P. T. The regulation of mitochondrial dynamics in neurite outgrowth by retinoic acid receptor beta signaling. FASEB Journal. 33 (6), 7225-7235 (2019).
- Mitra, K., Lippincott-Schwartz, J. Analysis of mitochondrial dynamics and functions using imaging approaches. Current Protocols in Cell Biology. Chapter 4 (Unit 4), 1-21 (2010).
- Sajic, M., et al. Impulse conduction increases mitochondrial transport in adult mammalian peripheral nerves in vivo. PLoS Biology. 11 (12), e1001754(2013).
- Lefebvre, A., Ma, D., Kessenbrock, K., Lawson, D. A., Digman, M. A. Automated segmentation and tracking of mitochondria in live-cell time-lapse images. Nature Methods. 18 (9), 1091-1102 (2021).
- Chu, C. -H., Tseng, W. -W., Hsu, C. -M., Wei, A. -C. Image analysis of the mitochondrial network morphology with applications in cancer research. Frontiers in Physics. 10, 855775(2022).
- Creed, S., McKenzie, M. Measurement of mitochondrial membrane potential with the fluorescent dye tetramethylrhodamine methyl ester (TMRM). Methods in Molecular Biology. 1928, 69-76 (2019).
- Kovalevich, J., Langford, D. Considerations for the use of SH-SY5Y neuroblastoma cells in neurobiology. Methods in Molecular Biology. 1078, 9-21 (2013).
- Sahin, M., Oncu, G., Yilmaz, M. A., Ozkan, D., Saybasili, H. Transformation of SH-SY5Y cell line into neuron-like cells: Investigation of electrophysiological and biomechanical changes. Neuroscience Letters. 745, 135628(2021).
- Trigo, D., et al. Mitochondria dysfunction and impaired response to oxidative stress promotes proteostasis disruption in aged human cells. Mitochondrion. 69, 1-9 (2022).
Access restricted. Please log in or start a trial to view this content.
Reprints and Permissions
Request permission to reuse the text or figures of this JoVE article
Request PermissionExplore More Articles
This article has been published
Video Coming Soon
Copyright © 2025 MyJoVE Corporation. All rights reserved