A subscription to JoVE is required to view this content. Sign in or start your free trial.
Method Article
Size Determination and Phenotypic Analysis of Urinary Extracellular Vesicles using Flow Cytometry
In This Article
Summary
This protocol describes a method for the isolation of urinary extracellular vesicles, uEVs, from healthy human donors and their phenotypic characterization by the size and surface marker expression using flow cytometry.
Abstract
Extracellular vesicles, EVs, are a heterogeneous complex of lipidic membranes, secreted by any cell type, in any fluid such as urine. EVs can be of different sizes ranging from 40-100 nm in diameter such as in exosomes to 100-1000 nm in microvesicles. They can also contain different molecules that can be used as biomarkers for the prognosis and diagnosis of many diseases. Many techniques have been developed to characterize these vesicles. One of these is flow cytometry. However, there are no existing reports to show how to quantify the concentration of EVs and differentiate them by size, along with biomarker detection. This work aims to describe a procedure for the isolation, quantification, and phenotypification of urinary extracellular vesicles, uEVs, using a conventional cytometer for the analysis without any modification to its configuration. The method's limitations include staining a maximum of four different biomarkers per sample. The method is also limited by the amount of EVs available in the sample. Despite these limitations, with this protocol and its subsequent analysis, we can obtain more information on the enrichment of EVs markers and the abundance of these vesicles present in urine samples, in diseases involving kidney and brain damage.
Introduction
In mammals, blood is filtered by passing through the kidneys 250 - 300 times; during this time, urine is formed. Production of this biofluid is the result of a series of processes, including glomerular filtration, tubular reabsorption, and secretion. Metabolic waste products and electrolytes are the main components of urine. Also, other byproducts such as peptides, functional proteins, and extracellular vesicles (EVs) are excreted1,2,3,4,5,6. Initially, urinary extracellular vesicles (uEVs) were identified in urine samples from patients suffering from water-balance disorders. These patients showed the presence of molecules such as aquaporin-2 (AQP2), which was then used as a biomarker for this disease7. Several subsequent studies focused on identifying the cellular origin of uEVs, describing that these structures can be secreted by kidney cells (glomerulus, podocytes, etc.) and other cell types of endothelial or leukocytic lineages. Moreover, the number and molecule-enrichment in uEVs can correlate with the status of many diseases and disorders8,9,10,11,12,13,14.
Altogether, EVs make up a highly heterogeneous family of particles enclosed by lipid bilayers and released by cells through passive or active mechanisms into different fluids. Depending on their origin, EVs can be classified as endosome originated exosomes or plasma membrane-derived microvesicles/microparticles. However, this classification criterion can only be applied when the biogenesis of the particles is directly observed. Therefore, other non-trivial criteria, including physical, biochemical, and cellular origin, have been endorsed by several researchers in the field15,16,17. Depending on the nature of the isolate analyzed, different analytical techniques were suggested for EVs characterization. For example, based on the enrichment of big (≥100 nm) or small (≤100 nm) EVs, quantification via flow cytometry or nanoparticle tracking is suggested, respectively18.
Nowadays, the use of EVs as biomarkers for many diseases has become relevant, so the search for different sources are been investigated. One of the most promising sources is the urine as it can be obtained in an easy and non-invasive manner. Therefore, this protocol describes a procedure for the isolation of uEVs by differential centrifugation, processing with fluorochrome-conjugated antibodies, and downstream analysis using a conventional 2-lasers/4-colors cytometer.
Protocol
The human urine samples were obtained from healthy volunteers who had signed donor-informed consent. These procedures were also approved by the Instituto Nacional de Ciencias Médicas y Nutrición Salvador Zubirán Research Ethics Committee.
1. Isolation of urinary extracellular vesicles
NOTE: The isolation protocol of uEVs is modified from ref.19. Figure 1 depicts the representation of the protocol to isolate uEVs.
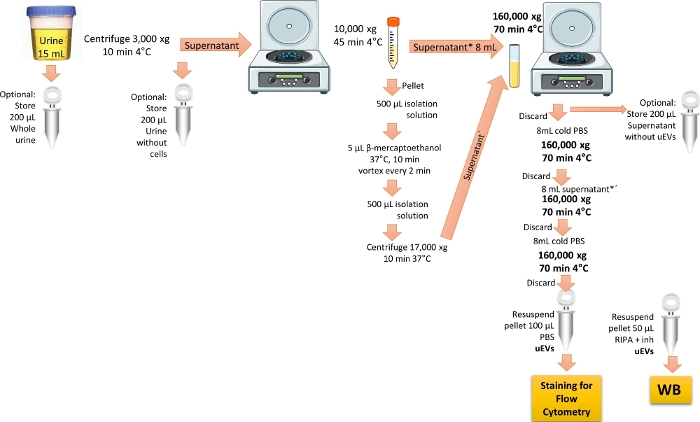
Figure 1: Overview of the uEVs isolation for flow cytometry analysis. In this protocol, first centrifuge the first urine of the day to remove the cells and debris. Then centrifuge to remove the large vesicles with treatment to remove the THP protein and finally perform ultracentrifugation to enrich and obtain the uEVs with a single wash. Steps to keep urine fractions for the WB validation are marked. Please click here to view a larger version of this figure.
- Use the first-morning urine (15 mL) from healthy volunteers. Centrifuge the urine at 3,000 x g for 10 min at 4 °C, to remove all the cells and debris.
NOTE: Preferentially use fresh urine; if not available, use urine stored for a maximum period of 3 months at -20 °C, or stored for a maximum period of 6 months at -70 °C. Thaw the urine sample on ice and vortex it vigorously. Perform all the procedures on ice or at 4 °C. An optional step for Western blot analysis is to make a duplicate tube and aliquot 200 µL of the first-morning urine in a separate tube. Store the sample at -20 °C until use, labeling it as "whole urine", to check for extracellular vesicle markers. - Transfer the supernatant obtained in step 1.1 to a new 15 mL conical centrifuge tube, then centrifuge at 10,000 x g for 45 min at 4 °C. Transfer the supernatant to an 8 mL polycarbonate ultracentrifugation tube and preserve this on ice.
NOTE: Optionally, aliquot 200 µL of the supernatant obtained in step 1.1 in a separate tube labeled as "urine without cells" for Western blot analysis.- Removal of Tamm-Horsfall protein, THP
NOTE: THP is present in urine and is enriched when an individual has renal disease. It has been reported that THP diminishes the yield of uEVs because it can bind to uEVs. To remove this protein, use of a reducing agent is neccesary3,6.- Prepare the isolation solution by mixing 250 mM sucrose with 10 mM triethanolamine. Adjust the pH to 7.6.
- Mix the pellet obtained in step 1.2 with 500 µL of isolation solution, and then add 5 µL of β-mercaptoethanol.
- Incubate the pellet-mix at 37 °C for 10 min, vortexing every 2 min. Add 500 µL of isolation solution and then centrifuge at 17,000 x g for 10 min at 37 °C. Collect the obtained supernatant (containing reduced-non aggregated THP plus uEVs).
- Removal of Tamm-Horsfall protein, THP
- Mix both the reserved supernatants (from steps 1.2 and 1.2.1.3) in the same 8 mL polycarbonate ultracentrifugation tube, and then centrifuge at 160,000 x g for 70 min at 4 °C, using an ultracentrifuge fixed-angle rotor.
NOTE: Optionally, for Western blot analysis, store 200 µL of the supernatant obtained above labeling it as "supernatant without EVs". This sample will serve as a negative control when searching for extracellular vesicle markers. - Discard the supernatant. Add ice-cold 1x PBS to the 8 mL polycarbonate tube and centrifuge at 160,000 x g for 70 min at 4 °C.
NOTE: Be careful not to discard the pellet, as it contains the uEVs. The 1x PBS needs to be sterilized and filtered with at least 0.22 µm pore syringe-filter. - Discard the supernatant. Add the rest of the supernatant to the 8 mL polycarbonate tube and centrifuge at 160,000 x g for 70 min at 4 °C.
- Discard the supernatant and add 8 mL of ice-cold PBS to the pellet to wash the uEVs.
- Discard the supernatant. Let the pellet dry and then resuspend it with 1 mL of ice-cold PBS. Store at -70 °C until use.
NOTE: If performing Western blot analysis, resuspend the duplicate tube's pellet with 50 µL of RIPA buffer plus protease inhibitors. Store at -20 °C until use.
2. Staining of uEVs
NOTE: Before staining and analysis of uEVs, it is essential to perform at least one methodology recommended by MISEV201818 to verify proper isolation of uEVs; here, Western blot analysis is depicted. Figure 2 shows a representative protocol to uEVs stain.
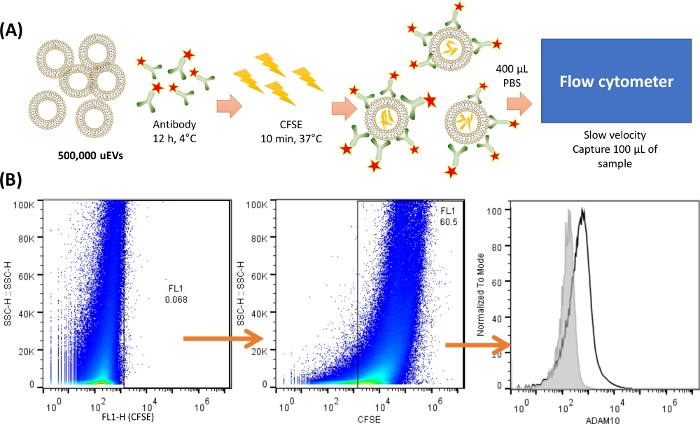
Figure 2: Overview of the uEVs staining and capture in the cytometer. (A) Representation of the uEV staining. For 500,000 uEVs, the antibody was mixed and incubated at 4 °C for 12 h. Then CFSE was added and incubated at 37 °C for 10 min. The uEVs had the CFSE inside, and the antibody will bind to the surface of the antigen. 400 µL of cold PBS was used to resuspend and to capture 100 µL of the sample in the flow cytometer at a slow velocity. (B) Analysis strategy. The first dot plot (SSC-H VS FL-X) depicts the negative control for uEVs, followed by the dot plot showing uEVs staining with CFSE, and finally, a histogram with the antibody staining of uEVs (black line), the negative control is shown in the grayline. Please click here to view a larger version of this figure.
- Calculate the relative number of uEVs by quantifying the protein content using any conventional colorimetric protein assay, as mentioned in the Table of Materials. Perform a 1:5 dilution of the uEVs and follow the instructions of the datasheet provided in the assay protein kit.
- Based on a previously reported formula20, consider 1 µg/mL of uEVs protein to be equal to 800,000 uEVs/ µL. Ensure 500,000 uEVs are present in 20 µL of ice-cold PBS.
- Label the tubes, as indicated in Table 1.
NOTE: The number of tubes used will depend on the number of antibodies employed, the limitation for 2-lasers/4 colors cytometer is a maximum of 4 antibodies per tube that could be used; therefore, only FL1, FL2, FL3, and FL4 in the cytometer could be read, although compensation is needed. For these procedures, use 1.5 mL microcentrifuge tubes or 5 mL round-bottom tubes for flow cytometry. Needed tubes are depicted in Table 1. Tubes 4 and 5 consist of a cocktail of all the antibodies to be used in this protocol. Two problem tubes (8 and 9) are given as an example; therefore, this set of controls must have the combination to be used in each tube.
| Tube 1. | Megamix FSC beads | |
| Tube 2. | PBS | |
| Tube 3. | PBS with CFSE | |
| Tube 4. | PBS with all antibodies of problem 1 | |
| Tube 5. | PBS with all antibodies of problem 2 | |
| Tube 6. | Autofluorescence control | uEVs without any reagent, only in PBS. |
| Tube 7. | #uEVs | uEVs with CFSE |
| Tube 8. | Problem 1 | uEVs with CD37 FITC, CD53 PE, ADAM10 APC |
| Tube 9. | Problem 2 | uEVs with CD9 FITC, TSPAN33 APC |
Table 1: Tubes labeling. Example showing how to label the tubes. The first tubes are all the controls needed. The tubes with the antibodies-fluorochromes will depend on the staining.
- Add 20 µL of PBS containing 500,000 uEVs to the labeled tubes.
- Add the antibodies as indicated in Table 1, previously titrated. Incubate overnight at 4 °C.
NOTE: Before staining, it is recommended to centrifuge the antibodies at 4 °C at full speed for at least 5 min, to prevent the aggregates. The antibodies used here are an example of proteins present in the uEVs and belong to an independent manuscript currently in preparation. - Add 0.4 µL of carboxyfluorescein succinimidyl ester (CFSE) [5 nM] to tube number 3. Incubate for 10 min at 37 °C.
NOTE: CFSE is a dye used to stain all the EVs present in a sample and discriminate between the background noise when a flow cytometer analysis is performed. For more information, see the Discussion section. - Add 400 µL of ice-cold 1x PBS to all the tubes.
- Keep all the tubes at 4 °C.
3. Acquisition of uEVs using a conventional cytometer
NOTE: Instructions for the use of the flow cytometer (see Table of Materials) are described here.
- Perform the quality calibration of the cytometer, using the 6- and 8-peak beads.
NOTE: The %CV of the last peak must be a value under 6; the cytometer technician will take care of this. - Open the flow cytometer software.
NOTE: Once the software is open, a new experiment will open, showing a screening with a template for 96 samples, the parameters for running, and an "empty" section to create dot plots or histograms. - Adjust the parameters on the screen of the software that is running: 100 µL of sample to capture, slow running, set the threshold at 10,000 on FSC-H, and 2,000 on SSC-H.
NOTE: The threshold recommended here is an example; it is required to set the threshold based on the samples analyzed. - Load tube number 1 (Megamix tube), as indicated in Table 1. Capture the beads. Create two dot plots in the "empty" part of the software screen by clicking on the Dot Plot option. Create as panel A and B of the Figure 3.
NOTE: The Megamix fluorescent beads (beads used to delimit the sizes of 0.1, 0.3, 0.5, and 0.9 µm and create the template for sizes), can be analyzed using the FL1 (FITC) detector. All the dot plots and histograms need to be displayed in height values. Record as many events as possible; any modification in the worksheet does not alter the data.
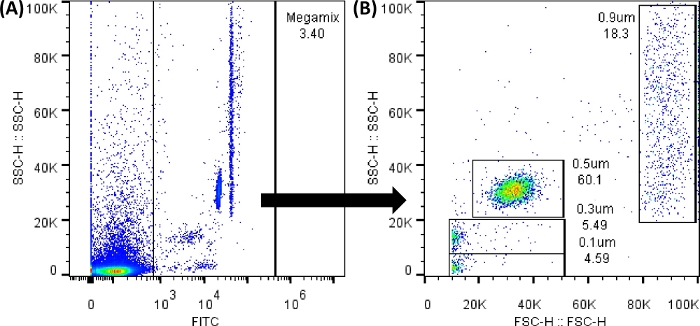
Figure 3: Megamix FSC beads dot plots. The dot plots showed were generated using the flow cytometer software; in the flow cytometer, the image will be very similar. (A) The first dot plot generated to select the beads avoiding the background noise. (SSC-H VS FL1-H). (B) The dot plot generated by the selection of the previous gate, showing the different sizes of the beads. (SSC-H VS FSC-H). Please click here to view a larger version of this figure.
- In the “empty” section of the software screen create a dot plot and histogram for each fluorochrome used; use the algorithm in Supplementary Figure 1 as an example. To do this, click on the Dot Plot or Histogram option for each fluorochrome.
NOTE: Background noise will always be present, as shown in Figure 3A. All the dots between 0 to 1,000 of FL1 (x-axis) are outside the created gate. Therefore, it is essential to use all the control tubes to obtain adequate results. Between every tube loading, backflush the sheath fluid and perform an unclog cycle. Gently shake every tube before loading. After loading five consecutive tubes, run 100 µL of PBS 1x. - Load tubes number 2 and 5, to set the cut-off values (negative). To do this, select the Rectangle Gate icon (located under the dot plot created), or Line Gate icon (located under the histogram created); and place it where there is no signal, in order to obtain dot plots and histograms like the ones shown in Supplementary Figure 1.
NOTE: All these tubes require the placement of the positive region not further than 0.70% because there will not be “fluorescence” more than 103 (1,500). If there is any fluorescence further than this region, dilute the reagents used. Therefore, it is important to titer the reagents before final measurements. - Load tube number 6 (autofluorescence tube), to set the negative regions for the sample. To do this, select the Rectangle Gate icon (located under the dot plot created), or Line Gate icon (located under the histogram created); place it where there is no signal.
- Load the next tubes (tubes 7 to 9, depicted in Table 1).
- Save the experiment.
NOTE: For the cytometer software used here, the command Save Experiment, refers to save the data generated. In other words, all the tubes that are acquired by the flow cytometer, and the data generated for each tube, need to be saved. To do this, it is necessary to click on the Save Experiment button. - Export data as FSC files.
4. Analysis of the data with a flow cytometer software.
NOTE: Instructions for using the flow cytometer software depicted in the table of materials, are described in this section. Figure 4 shows the workspace with the steps to create the size gates.
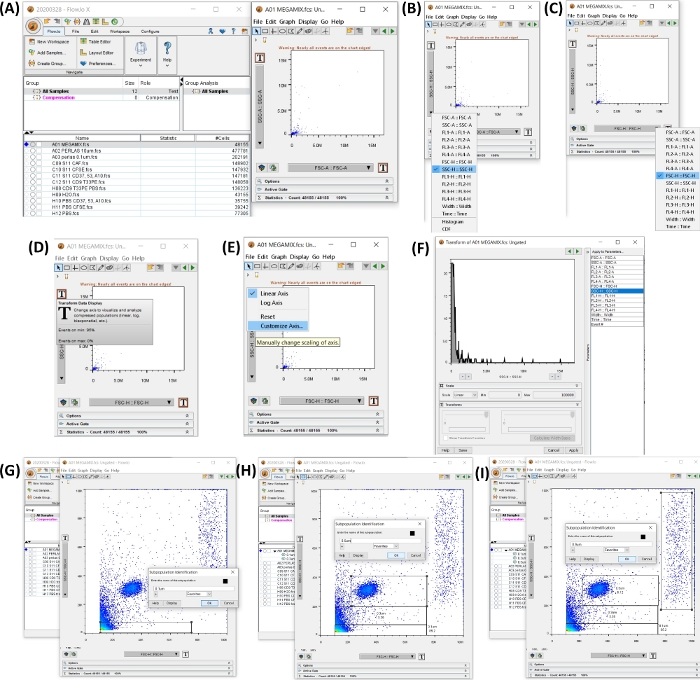
Figure 4: Workspace with all the steps to begin the analysis of the data. All the images were generated by screen printing of the workspace. (A) Workspace generated with the sample data added (left), dot plot generated by the selection of the tube 1, FSC beads, (right). (B,C) show the modification of the axis, to have SSC-H and FSC-H. (D-F) show step-by-step customization of both axes. (G-I) show the selection and generation of the different bead sizes. Please click here to view a larger version of this figure.
- Open the flow cytometer software. Add the samples, by clicking on the Add Samples button, and select the exported FCS files.
- Click on the Megamix tube to open a dot plot SSC-H (y-axis) VS FSC-H (x-axis). Adjust both axes to view 0 to 100,000 by clicking on the T button (Transform Data Display), click on Customize Axis, click on SSC-H or FSSC-H and change the scale value to min 0 and max 100,000 (see Figure 4A-F).
- Set the gates for 0.1, 0.3, 0.5, and 0.9 µm, in the dot plot generated in step 4.2. Select the Rectangle Gate button to create a gate as depicted in Figure 4G-I.
NOTE: Figure 5 shows the workspace with the steps to create the positive regions, and to obtain the Mean Intensity for the fluorochrome.
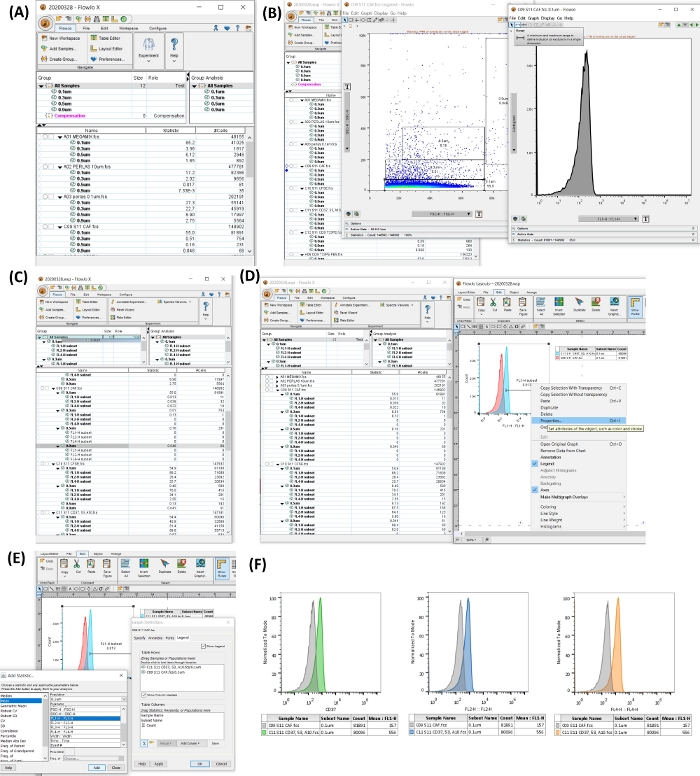
Figure 5: Workspace to analyze the data obtained. All the images were generated by the screen printing of the workspace. (A) Workspace generated with the size gate applied to all the samples. (B) Autofluorescence tube selected, dot plot showing the size gate, and the histogram for one selected size (0.1 µm), use this histogram to obtain the positive gate for each fluorochrome and size. (C) Workspace generated with the positive gates for each fluorochrome and size. (D) Workspace (left) and Layout Editor (right) generated for the samples. In the Layout Editor is shown the histogram for autofluorescence tube and positive tube for FL1-H, and how to obtain the properties panel to modify them. (E) The image shows how to obtain the mean intensity fluorescence value. (F) Histograms generated for three different fluorochromes, showing all the changes that the software allows to do with the statistic information. Please click here to view a larger version of this figure.
- Apply the generated gates (0.1, 0.3, 0.5, and 0.9 µm) to all the samples. Select the Gates, drag and drop in the All Samples option, as depicted in Figure 5A.
- Click on the Autofluorescence tube. Set the positive regions for each fluorochrome, for each size. Open the dot plot SSC-H VS FSC-H with the size gates, click on Single Gate Size. In the new window, click on the y-axis to select the histogram option. In the x-axis, select FL1-H, then select the Range icon to create the positive region. Repeat the operation for FL2-H and FL4-H (see Figure 5B).
- Apply the gates to all the samples. Select Gates, drag and drop in the All Samples option, as depicted in Figure 5C.
- Open the Layout Editor.
- Drag and drop each sample in the editor. Select the size of the “autofluorescence” tube, drag and drop, then select the same size of the stained tube, drag, and drop.
- Click the right bottom on the histogram. Open the Properties menu. Click on Legend. Add the mean intensity for the fluorochrome.
NOTE: In Properties, there are other available tools to modify the appearance of the histogram. - Repeat the same procedure for the remaining fluorochromes and sizes.
5. Analysis to obtain the number of uEVs per sample.
NOTE: Figure 6 shows the workspace with the steps to obtain the number of uEVs per sample.
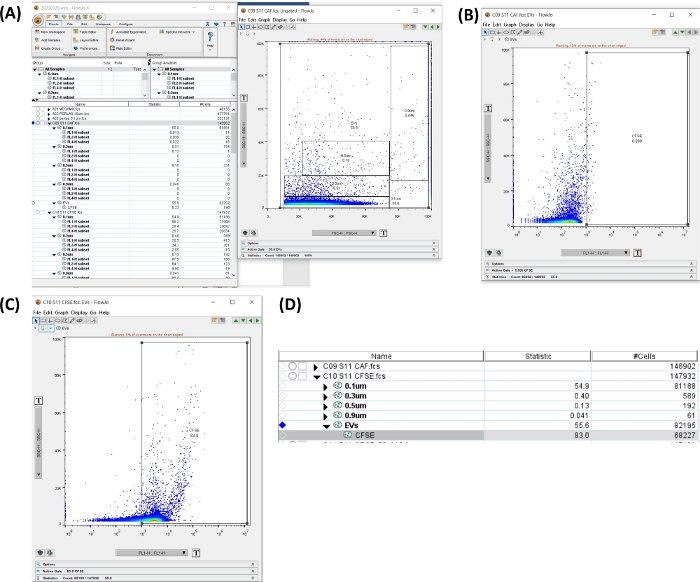
Figure 6: Workspace to analyze the CFSE tube. All the images were generated by screen printing of the workspace. (A) Workspace generated by the selection of all the sizes region, uEVs total (left), dot plot showing the gate selected (right). (B) Dot plot SSC-H VS FL1-H for CFSE negative region in the autofluorescence tube. (C) Dot plot SSC-H VS FL1-H for CFSE in the staining tube. (D) Image of the table obtained with the statistics of the CFSE staining, showing the number of uEVs in the sample. Please click here to view a larger version of this figure.
- Click on Autofluorescence tube. In the dot plot SSC-H VS FSC-H with the size gates, create a region including all the sizes. Click on New Region. Set the positive region (see Figure 6A,B).
- Apply the gates to all the samples. Select the gates, drag, and drop in the All Samples option.
- Click on CFSE + uEVs tube. Open the new region and verify the positive region for CFSE (FL1-H), as depicted in Figure 6C.
- At the workspace in Figure 6D, copy the # cells data for the tube. This number is the #uEVs obtained by flow cytometry (#uEVs FC).
- Apply the following formula to calculate the number of uEVs per microliter:

- To have the #uEVs per microliter for each fluorochrome (#uEVs/µL FLX), at the workspace, copy the statistics for the FLX-H subset, this number is the percentage (%FLX subset).
- Apply the following formula to calculate the number of uEVs per microliter for each fluorochrome.

NOTE: Depending on whether the selected gate will be for one size or for all the uEVs, verify the selected data.
Results
There are several checkpoints through the protocol, and before the staining of uEVs. Therefore, it is essential to first verify the amount of protein present in the extract of uEVs. All the research groups that work with extracellular vesicles quantify the protein, as indicated in step 2.1. Supplementary Figure 2 shows a representative 96 well plate containing uEVs fraction in wells 4E, 5E, and 6E. Wells 1A, 2A, and 3A consist of blanks, but if there are no uEVs purified, the wells will take similar colo...
Discussion
Nowadays, the use of extracellular vesicles as biomarkers for several diseases has augmented, especially for those that can be isolated from non-invasive sources such as urine5,21,22,23,24. It has been proved that the isolation of uEVs is a vital resource to know the status of a healthy individual, and the diagnosis/prognosis of patients suffering several dise...
Disclosures
The authors declare that the research was conducted in the absence of any financial or commercial relationship that could be construed as a potential conflict of interest.
Acknowledgements
This work was supported by grants from CONACyT (A3-S-36875) and UNAM-DGAPA-PAPIIT Program (IN213020 and IA202318). NH-I was supported by fellowship 587790 from CONACyT.
The authors want to thank Leopoldo Flores-Romo†, Vianney Ortiz-Navarrete, Antony Boucard Jr and Diana Gómez-Martin for their valuable advice for the realization of this protocol, and to all the healthy individuals for their urine samples.
Materials
| Name | Company | Catalog Number | Comments |
| APC anti human CD156c (ADAM10) antibody | BioLegend | 352706 | Add 5 µL to the 20 µL of uEVs in PBS |
| APC anti human TSPAN33 (BAAM) antibody | BioLegend | 395406 | Add 5 µL to the 20 µL of uEVs in PBS |
| Avanti centrifuge with JA-25.5O fixed angle rotor | Beckamn Coulter | J-26S XPI | |
| BD Accuri C6 Flow Cytometer | BD Biosciences | ||
| β-mercaptoethanol | SIGMA-Aldrich | M3148 | |
| Benchtop centrifuge with A-4-44 rotor | Eppendorf | 5804 | |
| BLUEstain 2 protein ladder | GOLDBIO | P008 | |
| CD9 (C-4) mouse monoclonal antibody | Santa Cruz Biotechnology | sc-13118 | |
| CD63 (MX-49.129.5) mouse monoclonal antibody | Santa Cruz Biotechnology | sc-5275 | |
| Cell Trace CFSE cell proliferation kit for flow cytometry | Thermo Scientific | C34554 | |
| Chemidoc XRS+ system | BIORAD | 5837 | |
| FITC anti human CD9 antibody | BioLegend | 312104 | Add 5 µL to the 20 µL of uEVs in PBS |
| FITC anti human CD37 antibody | BioLegend | 356304 | Add 5 µL to the 20 µL of uEVs in PBS |
| Fluorescent yellow particles | Spherotech | FP-0252-2 | |
| Fluorescent yellow particles | Spherotech | FP-0552-2 | |
| Fluorescent yellow particles | Spherotech | FP-1552-2 | |
| FlowJo Software | Becton, Dickinson and Company | ||
| Goat anti-mouse immunoglobulins/HRP | Dako | P0447 | |
| Halt protease inhibitor cocktail | Thermo Scientific | 78429 | |
| Immun-Blot PVDF membrane 0.22µm | BIORAD | 1620177 | |
| Megamix-Plus FSC beads | COSMO BIO CO.LTD | 7802 | |
| NuPAGE LDS sample buffer 4X | Thermo Scientific | NP0007 | |
| Optima ultracentrifuge with rotor 90Ti fixed angle 355530 | Beckamn Coulter | XPN100 | |
| Page Blue protein staining solution | Thermo Scientific | 24620 | |
| PE anti human CD53 antibody | BioLegend | 325406 | Add 5 µL to the 20 µL of uEVs in PBS |
| Pierce BCA Protein assay kit | Thermo Scientific | 23227 | |
| Pierce RIPA buffer | Thermo Scientific | 89900 | |
| Polycarbonate thick wall centrifuge tubes | Beckamn Coulter | 355630 | |
| Spherotech 8-Peak validation beads (FL1-FL3) | BD Accuri | 653144 | |
| Spherotech 6-Peak validation beads (FL4) | BD Accuri | 653145 | |
| Sucrose | SIGMA-Aldrich | 59378 | |
| Triethanolamine | SIGMA-Aldrich | 90279 |
References
- Decramer, S., et al. Urine in clinical proteomics. Molecular & Cellular Proteomics. 7 (10), 1850-1862 (2008).
- Nawaz, M., et al. The emerging role of extracellular vesicles as biomarkers for urogenital cancers. Nature Reviews Urology. 11 (12), 688-701 (2014).
- Pisitkun, T., Johnstone, R., Knepper, M. A. Discovery of urinary biomarkers. Molecular & Cellular Proteomics. 5 (10), 1760-1771 (2006).
- Urinology Think Tank Writing Group. Urine: Waste product or biologically active tissue. Neurourology and Urodynamics. 37 (3), 1162-1168 (2018).
- Wang, S., Kojima, K., Mobley, J. A., West, A. B. Proteomic analysis of urinary extracellular vesicles reveal biomarkers for neurologic disease. EBioMedicine. 45, 351-361 (2019).
- Merchant, M. L., Rood, I. M., Deegens, J. K. J., Klein, J. B. Isolation and characterization of urinary extracellular vesicles: implications for biomarker discovery. International Urology and Nephrology. 13 (12), 731-749 (2017).
- Alvarez, M. L., Khosroheidari, M., Kanchi Ravi, R., DiStefano, J. K. Comparison of protein, microRNA, and mRNA yields using different methods of urinary exosome isolation for the discovery of kidney disease biomarkers. Kidney International. 82 (9), 1024-1032 (2012).
- Jing, H., et al. The role of extracellular vesicles in renal fibrosis. Cell Death and Disease. 10 (5), 367 (2019).
- Liu, X., et al. Tubule-derived exosomes play a central role in fibroblast activation and kidney fibrosis. Kidney International. 97 (6), 1181-1195 (2020).
- Quaglia, M., et al. Extracellular Vesicles as Mediators of Cellular Crosstalk Between Immune System and Kidney Graft. Frontiers in Immunology. 11, 74 (2020).
- Simpson, R. J., Lim, J. W., Moritz, R. L., Mathivanan, S. Exosomes: proteomic insights and diagnostic potential. Expert Review of Proteomics. 6 (3), 267-283 (2009).
- Street, J. M., Koritzinsky, E. H., Glispie, D. M., Star, R. A., Yuen, P. S. Urine Exosomes: An Emerging Trove of Biomarkers. Advances in Clinical Chemistry. 78, 103-122 (2017).
- Thongboonkerd, V. Roles for Exosome in Various Kidney Diseases and Disorders. Frontiers in Pharmacology. 10, 1655 (2019).
- Watanabe, Y., et al. Molecular Network Analysis of the Urinary Proteome of Alzheimer's Disease Patients. Dementia and Geriatric Cognitive Disorders Extra. 9 (1), 53-65 (2019).
- Jadli, A. S., Ballasy, N., Edalat, P., Patel, V. B. Inside(sight) of tiny communicator: exosome biogenesis, secretion, and uptake. Molecular and Cellular Biochemistry. 467 (1-2), 77-94 (2020).
- Svenningsen, P., Sabaratnam, R., Jensen, B. L. Urinary extracellular vesicles: Origin, role as intercellular messengers and biomarkers; efficient sorting and potential treatment options. Acta Physiologica. 228 (1), 13346 (2020).
- Witwer, K. W., Thery, C. Extracellular vesicles or exosomes? On primacy, precision, and popularity influencing a choice of nomenclature. Journal of Extracellular Vesicles. 8 (1), 1648167 (2019).
- Thery, C., et al. Minimal information for studies of extracellular vesicles 2018 (MISEV2018): a position statement of the International Society for Extracellular Vesicles and update of the MISEV2014 guidelines. Journal of Extracellular Vesicles. 7 (1), 1535750 (2018).
- Perez-Hernandez, J., et al. Increased Urinary Exosomal MicroRNAs in Patients with Systemic Lupus Erythematosus. PLoS One. 10 (9), 0138618 (2015).
- Freyssinet, J. M., Toti, F. Membrane microparticle determination: at least seeing what's being sized. Journal of Thrombosis and Haemostasis. 8 (2), 311-314 (2010).
- D'Anca, M., et al. Exosome Determinants of Physiological Aging and Age-Related Neurodegenerative Diseases. Frontiers in Aging Neuroscience. 11, 232 (2019).
- Lawson, C., Vicencio, J. M., Yellon, D. M., Davidson, S. M. Microvesicles and exosomes: new players in metabolic and cardiovascular disease. Journal of Endocrinology. 228 (2), 57-71 (2016).
- Lee, S., Mankhong, S., Kang, J. H. Extracellular Vesicle as a Source of Alzheimer's Biomarkers: Opportunities and Challenges. International Journal of Molecular Sciences. 20 (7), (2019).
- Mori, M. A., Ludwig, R. G., Garcia-Martin, R., Brandao, B. B., Kahn, C. R. Extracellular miRNAs: From Biomarkers to Mediators of Physiology and Disease. Cell Metabolism. 30 (4), 656-673 (2019).
- Hoorn, E. J., et al. Prospects for urinary proteomics: exosomes as a source of urinary biomarkers. Nephrology (Carlton). 10 (3), 283-290 (2005).
- Ranghino, A., Dimuccio, V., Papadimitriou, E., Bussolati, B. Extracellular vesicles in the urine: markers and mediators of tissue damage and regeneration. Clinical Kidney Journal. 8 (1), 23-30 (2015).
- Zhang, W., et al. Extracellular vesicles in diagnosis and therapy of kidney diseases. American Journal of Physiology-Renal Physiology. 311 (5), 844-851 (2016).
- Fernandez-Llama, P., et al. Tamm-Horsfall protein and urinary exosome isolation. Kidney International. 77 (8), 736-742 (2010).
- Royo, F., et al. Different EV enrichment methods suitable for clinical settings yield different subpopulations of urinary extracellular vesicles from human samples. Journal of Extracellular Vesicles. 5, 29497 (2016).
- Rider, M. A., Hurwitz, S. N., Meckes, D. G. ExtraPEG: A Polyethylene Glycol-Based Method for Enrichment of Extracellular Vesicles. Scientific Reports. 6, 23978 (2016).
- Lv, C. Y., et al. A PEG-based method for the isolation of urinary exosomes and its application in renal fibrosis diagnostics using cargo miR-29c and miR-21 analysis. International Urology and Nephrology. 50 (5), 973-982 (2018).
- Alvarez, M. L., Khosroheidari, M., Kanchi Ravi, R., DiStefano, J. K. Comparison of protein, microRNA, and mRNA yields using different methods of urinary exosome isolation for the discovery of kidney disease biomarkers. Kidney International. 82 (9), 1024-1032 (2012).
- Wang, D., Sun, W. Urinary extracellular microvesicles: isolation methods and prospects for urinary proteome. Proteomics. 14 (16), 1922-1932 (2014).
- Pospichalova, V., et al. Simplified protocol for flow cytometry analysis of fluorescently labeled exosomes and microvesicles using dedicated flow cytometer. Journal of Extracellular Vesicles. 4, 25530 (2015).
- van der Pol, E., et al. Standardization of extracellular vesicle measurements by flow cytometry through vesicle diameter approximation. Journal of Thrombosis and Haemostasis. 16 (6), 1236-1245 (2018).
- Huyan, T., Du, Y., Huang, Q., Huang, Q., Li, Q. Uptake Characterization of Tumor Cell-derived Exosomes by Natural Killer Cells. Iranian Journal of Public Health. 47 (6), 803-813 (2018).
- Puzar Dominkus, P., et al. PKH26 labeling of extracellular vesicles: Characterization and cellular internalization of contaminating PKH26 nanoparticles. Biochimica et Biophysica Acta (BBA) - Biomembranes. 1860 (6), 1350-1361 (2018).
- Morales-Kastresana, A., et al. Labeling Extracellular Vesicles for Nanoscale Flow Cytometry. Scientific Reports. 7 (1), 1878 (2017).
- de Rond, L., et al. Comparison of Generic Fluorescent Markers for Detection of Extracellular Vesicles by Flow Cytometry. Clinical Chemistry. 64 (4), 680-689 (2018).
Reprints and Permissions
Request permission to reuse the text or figures of this JoVE article
Request PermissionThis article has been published
Video Coming Soon
Copyright © 2025 MyJoVE Corporation. All rights reserved