
Method Article
Kinase Inhibitor Screening In Self-assembled Human Protein Microarrays
In This Article
Summary
A detailed protocol for the generation of self-assembled human protein microarrays for the screening of kinase inhibitors is presented.
Abstract
The screening of kinase inhibitors is crucial for better understanding properties of a drug and for the identification of potentially new targets with clinical implications. Several methodologies have been reported to accomplish such screening. However, each has its own limitations (e.g., the screening of only ATP analogues, restriction to using purified kinase domains, significant costs associated with testing more than a few kinases at a time, and lack of flexibility in screening protein kinases with novel mutations). Here, a new protocol that overcomes some of these limitations and can be used for the unbiased screening of kinase inhibitors is presented. A strength of this method is its ability to compare the activity of kinase inhibitors across multiple proteins, either between different kinases or different variants of the same kinase. Self-assembled protein microarrays generated through the expression of protein kinases by a human-based in vitro transcription and translation system (IVTT) are employed. The proteins displayed on the microarray are active, allowing for measurement of the effects of kinase inhibitors. The following procedure describes the protocol steps in detail, from the microarray generation and screening to the data analysis.
Introduction
Protein kinases are responsible for the phosphorylation of their targets and can modulate complex molecular pathways that control many cellular functions (i.e., cell proliferation, differentiation, cell death and survival). Deregulation of kinase activity is associated with more than 400 diseases, making kinase inhibitors one of the main classes of drugs available for treatment of several diseases, including cancer, cardiovascular and neurological disorders as well as inflammatory and autoimmune diseases1,2,3.
With the advent of precision medicine, the identification of new therapies, especially kinase inhibitors, have great appeal pharmaceutically and clinically. Several approaches can be used for the identification of possible new pairs of kinase/kinase inhibitors, including the de novo design of kinase inhibitors and identification of new targets for existing FDA-approved drugs. The latter is especially attractive, since the time and money required to implement these drugs in clinics are drastically reduced due to the availability of previous clinical trial data. A canonical example of the repurposing of a kinase inhibitor is imatinib, initially designed for the treatment of chronic myelogenous leukemia (CML) through the inhibition of BCR-Abl, which can also be successfully used for the treatment of c-Kit over-expressing gastrointestinal stromal tumors (GISTs)4,5,6,7.
The screening of kinase inhibitors can be performed in binding assays or enzymatic-based assays. The first class of assays focuses on protein-drug interactions and can provide information such as ligation site and affinity. Since the activity of the kinase at the time of these assays is unknown, a number of interactions may be missed or falsely identified due to conformational changes in the protein. On the other hand, enzymatic-based assays require the protein kinases to be active and provide valuable information regarding the inhibitor’s effect on enzyme activity, however, this type of screening is generally more time consuming and expensive. Currently, both types of assays are commercially available from several sources. They represent a reliable option for the screening of kinase inhibitors with a few limitations, including: I) most of the methods involve testing of multiple kinases individually, which can make the screening of a large set of proteins costly; II) the set of kinases to be tested is limited to a list of preselected, wild-type kinases and several well-known mutated versions of some kinases, hindering the testing of many new mutated isoforms.
In this context, protein microarrays are a powerful platform capable of overcoming some of the limitations presented by commercially available techniques. It is suitable to perform enzymatic-based assays in high-throughput screening using full-length, active proteins of any sequence of interest. The microarrays can be generated by a self-assembled approach like NAPPA (nucleic acid programmable protein array), in which proteins are expressed just in time for the assays, increasing the likelihood that those displayed on the array are indeed active. The proteins displayed on NAPPA are produced using human-derived ribosomes and chaperone proteins in order to improve the likelihood of natural folding and activity.
The proteins are initially programmed by printing cDNAs coding for genes of interest fused with a capture tag, together with a capture agent, onto the microarray surface. The proteins are then produced on the microarrays using an in vitro transcription and translation (IVTT) system, and the freshly expressed proteins are immobilized on the microarray surface by the capture agent. Expressed NAPPA arrays can be used for the study of the proteins displayed on the array in an unbiased, high-throughput manner8,9.
Previously, it was shown that proteins displayed on NAPPA arrays are folded properly to interact with known partners10; furthermore, their enzymatic activity was first exploited in 2018, when it was shown that protein kinases displayed on the microarray autophosphorylate11. To date, NAPPA methodology has been used for many distinct applications, including biomarker discovery12,13,14,15,16,17, protein-protein interactions10,18, substrate identification19, and drug screening11. Its flexibility is one of the platform’s key characteristics that allows for adaptation to each application.
Here, a protocol for the screening of tyrosine kinase inhibitors in self-assembled NAPPA arrays is presented. The platform is optimized for the display of active human protein kinases and for the analysis of protein kinase activity, with low background and high dynamic range. Among the modifications implemented to use NAPPA for the screening of kinase inhibitors include: I) changes in the printing chemistry, II) de-phosphorylation of the protein microarray prior to the kinase inhibitor screening, and III) optimization of detection of phosphorylated proteins on the array. This protocol is the first of its kind and provides unique information about the kinase study in NAPPA microarrays.
Protocol
1. Common buffers and solutions to be used
- Prepare TB medium: Terrific broth (24 g/L yeast extract; 20 g/L tryptone; 4 mL/L glycerol; 0.017 M KH2PO4; and 0.072 M K2HPO4). The 0.017 M KH2PO4 and 0.072 M K2HPO4 solutions can be purchased as a 10x phosphate buffer (0.17 M KH2PO4 and 0.72 M K2HPO4).
- Prepare LB medium: Luria-Bertani (5 g/L yeast extract; 10 g/L tryptone; and 10 g/L NaCl). Adjust the pH to 7.0 with 5 M NaOH.
- Prepare 1x TBS: Tris-buffered saline (TBS: 50 mM Tris-Cl, pH = 7.5; 150 mM NaCl).
- Prepare 1x TBST: TBS supplemented with 0.1% Tween 20.
2. DNA preparation
NOTE: The DNA utilized for NAPPA arrays must be highly pure; therefore, commercial DNA mini-preps are not recommended. Currently, two protocols for DNA preparation are used: in house high-throughput mini-prep (described here) or commercial Midi- or Maxi-prep. The average throughput of the in-house mini-prep protocol is 1,500 samples a day per person.
- Bacterial growth for in-house high-throughput mini-prep
- Prepare LB/Agar omni plate. Pour 30–40 mL of LB agar (1.5 % bacteriological agar in LB media supplemented with antibiotic for selection of positive clones) into each single well plate.
- Spot glycerol stock on LB/agar plate. Dilute glycerol stock in LB media (1:300, usually 2 µL in 600 µL of LB). Shake for 10 min. Spot 3 µL of the diluted stock onto the LB/agar plate. Incubate at 37 °C, upside-down, overnight.
- Inoculate cultures. Using the 96-pin device that was sterilized in 80% ethanol and flame, inoculate the culture from the agar plate in a deep-well block with 1.5 mL per well of TB medium supplemented with antibiotic.
- Incubate cultures. Cover the block with a gas permeable seal and incubate for 22–24 h at 37 °C, 300–800 rpm depending on shaker.
NOTE: Shakers set at 800 rpm are optimal for this incubation. Use of a slower speed shaker may result in less dense cultures and lower DNA purification yields. - Pellet cultures. Spin blocks at 3,800 x g and 4 °C for 30 min. Discard supernatant.
- In-house high-throughput mini-prep
NOTE: Multi-channel pipettors or automatic dispensers can be used to perform the in-house high-throughput mini-prep. If using an automatic dispenser, make sure to clean the system prior to use and in between solutions.- Prepare all the solutions used during the mini-prep:
- Prepare Solution 1: TE resuspension buffer (50 mM Tris, pH = 8.0; 10 mM EDTA, pH = 8.0; 0.1 mg/mL RNAse). Store at 4 °C.
- Prepare Solution 2: NaOH/SDS lysis buffer (0.2 M NaOH; 1% SDS). For better results, a freshly made solution should be used.
- Prepare Solution 3: KOAC neutralization buffer (2.8 M KOAc). Adjust the pH of the solution to 5.1 with glacial acetic acid. Store at 4 °C.
- Prepare Solution N2: equilibration buffer (100 mM Tris; 900 mM KCl; 15% EtOH; 0.15% Triton X-100). Adjust the pH of the solution to 6.3 with phosphoric acid.
- Prepare Solution N3: bash buffer (100 mM Tris; 1.15 M KCl; 15% EtOH). Adjust the pH of the solution to 6.3 with phosphoric acid.
- Prepare Solution N5: elution buffer (100 mM Tris; 1 M KCl; 15% EtOH). Adjust the pH of the solution to 8.5 with phosphoric acid.
NOTE: Successful control of the DNA binding, washing, and elution during anion exchange is highly dependent on buffer KCl concentration and pH values. Careful buffer component measurements and pH adjustment are essential. Small deviations from the described measurements can result in significant loss of yields.
- Re-suspend pellet. Add 200 µL of solution 1 and shake at 2,000 rpm for 5 min at RT. Complete re-suspension of the pellet is necessary for successful lysis. Vortex the block if necessary.
- Lyse bacteria. Add 200 µL of solution 2, seal the plate with an aluminum seal and invert 5x. Carefully time this step from the beginning of solution 2 addition. Do not exceed 5 min.
- Neutralize solution. Add 200 µL of solution 3, seal the plate with an aluminum seal and invert 5x. The seal may be loose due to the lysis/neutralization buffers, so use caution when inverting. A partial inversion, in which the solution never touches the seal, is recommended to prevent cross-contamination among samples.
- Clear lysate. Centrifuge the plates at 3,800 x g and 4 °C for 30 min.
- Prepare anion exchange resin slurry during the lysate pelleting centrifugation step. Using a 1 L bottle, fill it with the anion exchange resin until it reaches the 300 mL mark, then add solution N2 up to 900 mL.
CAUTION: This step should be done in the hood to protect against silica inhalation. - Prepare anion exchange resin plates. Stack the filter plates on top of a deep well block to act as a waste collection vessel. Mix the anion exchange slurry until it is homogeneous, then pour into a glass trough. Using wide-bored P1000 tips, transfer 450 µL of the slurry into each well of the filter plates.
- Centrifuge stacked plates (resin plate/deep well plate) at slow acceleration for 5 min at 130 x g and RT. Discard the flow through.
- Transfer lysate supernatant to the resin plate/deep well block stacks. Spin the stacked plates for 5 min at 30 x g with slow ramp-up speed.
- Wash column. Add 400 µL of solution N3 (wash buffer) to each well. Transfer the resin plate to vacuum manifold to remove the wash buffer. Repeat the washing steps 3x. On the last wash, make sure all wells are properly emptied. Spin the stack plates at 150 x g for 5 min to remove any residual buffer.
- Elute DNA. Place the resin plate onto a clean 800 µL collection plate. Add 300 µL of solution N5 to each well. Let it sit at RT for 10 min, then spin the stacked plates for 5 min at 20 x g with slow ramp-up speed. Spin the stacked plates for 1 min at 233 x g.
- Quantify DNA and store plates at -20 °C until further use or proceed straight to DNA precipitation.
NOTE: A minimum of 30 µg of DNA per sample is necessary. If the DNA yield is low, it is recommended to repeat the DNA mini-prep, or alternatively combine two plates during the precipitation step (section 2.3).
- Prepare all the solutions used during the mini-prep:
- DNA precipitation
- Thaw out plates, vortex to homogenize the DNA solution, and spin at 230 x g for 30 s to collect all solution in the bottom of the well.
- Add 40 µL of 3 M NaOAc and 240 µL of isopropanol to each well. Cover the plate with an aluminum seal and mix by inverting 3x.
- Centrifuge the plates at for 30 min at 3,800 x g and 25 °C. Carefully discard the supernatant.
NOTE: To combine two plates, transfer the DNA from the second plate into the pellet from the first plate and repeat steps 2.3.2–2.3.3. - Wash and precipitate the DNA. Add 400 µL of 80% ethanol to each well. Seal plates with aluminum seal and shake at 1,000 rpm for 30 min. Centrifuge at 3,800 x g for 30 min at 25 °C. Discard the supernatant.
- Dry the DNA pellets. Place the plates upside-down at an angle on paper towels and let them dry for 1–2 h, until no alcohol is present at the bottom of the well. Seal and centrifuge at 230 x g for 2 min to bring any pellets down.
- Once plates are dry, either seal with aluminum seal and freeze at -20 °C for later use or continue to resuspend the DNA (step 4.1).
3. Aminosilane slide coating
- Place the glass slides in metal rack. Visually inspect each slide to assure no scratches or imperfections are present.
- Submerge slides in coating solution (2% aminosilane reagent in acetone) for 15 min while rocking. The aminosilane solution can be used to coat two racks of 30 slides each before it needs to be discarded.
- Rinse step. Submerge the slide rack in acetone wash (99% acetone), shake back and forth, then up and down quickly 5x. Tilt to one corner to drip off, then submerge in Ultrapure water up and down quickly 5x. Tilt to drip off, then place on napkins.
NOTE: Acetone wash can be used twice, while the ultrapure water must be changed each time. - Dry slides using pressured air, blowing on them from all angles for about 3 min until all water droplets have been removed. Store the coated slides at RT in a metal rack inside a tightly sealed box.
4. Array sample preparation
- Resuspend the DNA pellet from the in-house mini-prep (step 2.3.6) in 20 µL of ultrapure water and shake at 1,000 rpm for 2 h. For midi/max prep DNA, dilute each sample to a final concentration of 1.5 µg/µL and transfer 20 µL to an 800 µL collection plate.
- Prepare printing mix. For one 96 well plate, prepare 1 mL of printing mix [237.5 µL of ultrapure water; 500 µL of poly-lysine (0.01%); 187.5 µL of BS3 (bis-sulfosuccinimidyl, 50 mg/mL in DMSO); and 75 µL of polyclonal anti-flag rabbit antibody)].
NOTE: The chemicals should be added in the specified order to avoid precipitation. - Add 10 µL of printing mix to each sample, seal plates with aluminum foil, and shake at RT for 90 min at 1,000 rpm. Store the plates overnight (~16 h) at 4 °C.
- On the printing day, briefly vortex and spin the plates. Transfer 28 µL of each sample to a 384 array plate. This transfer can be done using automation or a multi-channel pipette. It is crucial to keep track of the position of the samples in the 384 array plate.
- Spin the plate down briefly to remove any bubbles. Seal the plates with foil.
5. Generation of NAPPA arrays: microarray printing
NOTE: All the printing conditions were optimized for the instrument listed in Table of Equipment and Materials. If using a different array, further optimization may be required.
- Arrayer clean up. Before starting, empty all waste tanks and refill the reservoirs with ultrapure water or 80% ethanol, if needed. Clean pins one-by-one with lint-free wipes and ultrapure water. Dry the pins with lint free wipes and carefully place them back into the arrayer head.
- Arrayer set up: printing specifications [maximum number of stamps per ink: 1; number of stamps per spot: 1; multi-stamp timing: --; stamp time (ms): 0 ms; inking time (ms): 0 ms; print depth adjustment: 90 microns; number of touch-offs: 0]. Then, follow the sterilization protocol: ultrapure water wash for 2,000 ms with 0 ms of drying time and 500 ms of waiting time; repeat these steps 6x; followed by washing with 80% ethanol for 2,000 ms with 1,200 ms of drying time and 500 ms of waiting time; repeat these steps 6x.
- Slide design: set up the arrayer with the desired arraying pattern. The design should take into consideration several factors [i.e., the number of replicas for each sample, location and number of the control features, array layout (one block, several identical blocks), number of arrays to be printed, length of the run, etc.].
- Place the aminosilane coated slides (step 3.4) on the arrayer deck. Check to see if the vacuum is holding all the slides securely in place. Start the humidifier (it should be set at 60%).
- Place the 384 well plate on arrayer deck. Start the program.
- Label the microarrays. When printing is done, place slide labels on the bottom (non-printed) side of each slide. Maintain the slides printing order on the deck in numerical order.
- Store the printed arrays at RT in a metal rack inside a tightly sealed box with a silica packet. Slides kept in a dry environment have a shelf life to up to one year.
- (Optional): a second batch of 90 slides can be printed using the same samples. To do so, remove the 384 well plate from the arrayer deck as soon as the printing of the plate is done. Seal and store the plate at 4 °C. After the first batch of arrays are completely done, remove them from the deck, place new aminosilane coated slides and start a new run. Make sure each 384 well plate is at RT for 30 min prior to its use. If more than four replicas per sample are printed in a batch of slides, it is recommended to split the 384 well plates into two plates to decrease sample evaporation by decreasing the amount of time spent on the arrayer deck.
NOTE: Check all reservoirs prior to the beginning of the second run.
6. Detection of DNA on NAPPA slides
- Block the slides. Place the slides in a pipette box and add 30 mL of blocking buffer. Incubate at RT for 1 h on a rocking shaker.
- Stain the slides. Discard the blocking solution and add 20 mL of blocking buffer and 33 µL of fluorescent DNA-intercalating dye. Incubate for 15 min with agitation. Then, quickly rinse the slides with ultrapure water and dry with pressured air. Proceed with the scanning (section 11).
7. Expression of NAPPA slides
- Block the slides with blocking buffer on a rocking shaker at RT for 1 h. Use approximately 30 mL in a pipette box for four slides.
- Rinse slides with ultrapure water and dry with filtered compressed air. Apply sealing gasket to each slide per the manufacturer’s instructions.
- Add IVTT mix. Each slide will require 150 µL of IVTT mix. Dilute 82.5 µL of HeLa lysate in 33 µL of DEPC water and supplement with 16.5 µL of accessory proteins and 33 uL of reaction mix. Add IVTT mix from the non-label or non-specimen end. Pipette the mix in slowly (it is acceptable if it beads up temporarily at the inlet end). Gently massage the sealing gasket so that the IVTT mix spreads out and covers the whole area of the array. Apply the small round port seals to both ports.
- Place the slides on a support and transfer them to the programable chilling incubator. Incubate for 90 min at 30 °C for protein expression, followed by 30 min at 15 °C for immobilization of the query protein.
- Wash and block the slides. Remove the sealing gasket and immerse slides in a pipette box with approximately 30 mL of 1x TBST supplemented with 5% milk for protein display (section 8) or 1x TBST supplemented with 3% bovine serum albumin (BSA) for kinase assays or drug screening (section 9). Incubate at RT with agitation for 20 min and repeat this step 2x.
8. Detection of proteins on NAPPA arrays
- Add primary antibody. Remove the slides from the blocking solution (step 7.5) and gently dry the back side (non-printed side) using a paper towel. Place the slides on a support and apply 600 µL of primary antibody (mouse anti-flag) diluted 1:200 in 1x TBST + 5% milk. Incubate for 1 h at RT.
- Wash the slides with 1x TBST + 5% milk on a rocking shaker (3x for 5 min each).
- Add secondary antibody. Remove the slides from the washing solution and gently dry the back side using paper towel. Place the slides on a support and apply 600 µL of secondary antibody (cy3-labbeled anti-mouse antibody) diluted 1:200 in 1x TBST + 5% milk. Protect the slides from light and incubate for 1 h at RT.
- Wash the slides with 1x TBST on a rocking shaker (3x for 5 min each). Quickly rinse the slides with ultrapure water and dry using pressured air. Proceed with the scanning (section 11).
9. Tyrosine kinase inhibitor screening on NAPPA arrays
NOTE: Multiple slides can be processed in the same experiment, however, make sure that in each step, one slide is processed at a time and that they do not dry between steps. Add all solutions to the non-label or non-specimen end of the slide.
- Prepare all the solutions used during the drug screening:
- Prepare phosphatase/DNase solution by combining the following: 1x protein metallo-phosphatases buffer (50 mM HEPES, 100 mM NaCl, 2 mM DTT, 0.01% Brij 35 at pH = 7.5); 1 mM MnCl2; 8,000 units of lambda protein phosphatase; and 2 units of DNase I. Prepare 400 µL of the solution for each microarray. Add phosphatase and DNase just prior to use.
- Make the drug dilution. Drugs are reconstituted in DMSO to a final concentration of 10 mM. To assure that all drug concentrations tested on the array, ensure that the same volume of DMSO (a 10,000x stock in DMSO) is created for each concentration and kept at -80 °C. At the time of use, drugs are diluted 1:100 in water.
- Prepare drug/kinase solution by combining the following: 1x kinase buffer (25 mM Tris-HCl of pH = 7.5); 5 mM beta-glycerophosphate; 2 mM DTT; 0.1 mM Na3VO4; 10 mM MgCl2; 500 µM ATP; and 2 µL of drug (diluted 1:100 in water). Prepare 200 µL of the solution for each microarray.
- Perform the phosphatase and DNase treatment. Remove slides from the blocking solution (step 7.5) and gently dry the backside using paper towel. Place the slides on support and apply 200 µL of phosphatase/DNase solution. Place a microarray coverslip to avoid evaporation. Incubate at 30 °C for 45 min in the oven.
- Phosphatase and DNase treatment II: remove arrays from the oven, discard the coverslip, remove excess solution, and apply 200 µL of freshly made phosphatase and DNase solution. Cover microarrays with coverslip and incubate for another 45 min at 30 °C in the oven.
- Wash slides with 1x TBST + 0.2 M NaCl on a rocking shaker (3x for 5 min each).
- Perform the drug treatment and kinase reaction. Remove slides from the washing solution and gently dry the backside using a paper towel. Place the slides on support and apply 200 µL of drug/kinase solution. Place a coverslip on top to avoid evaporation. Incubate for 1 h at 30 °C in the oven.
- Wash slides with 1x TBST + 0.2 M NaCl on a rocking shaker (3x for 5 min each).
- Repeat steps 8.1–8.4 using as primary antibody anti-phosho-Tyr antibody diluted 1:100. Replace 1x TBST + 5% milk in all steps with 1x TBST + 3% BSA.
10. Automated hybridization protocol
NOTE: Alternatively, a hybridization station can be used to automate all hybridizations and washes on the NAPPA arrays (sections 7–9) and the protocol is provided as Supplementary File 1.
11. Image acquisition
NOTE: Microarray images should be acquired at a resolution of 20 microns or higher.
- Load microarrays into the slide holder magazine with the proteins facing up. Load the magazine into the microarray scanner.
- Select the green laser with a 575/30 nm emission filter to scan the signal from the cy-3 labelled secondary antibody. If a different fluorophore is used, select the correct laser/wavelength to detect the signal from the fluorescent dye.
- Define the name for each image and the location that they will be saved.
- (Optional): for each new fluorophore, optimization of the scanning conditions are recommended to detect the linear range of the signal intensity. To do so, scan a microarray using a range of photomultiplier (PMT) and gain until a clear image is obtained with non-saturated signal and low background.
- Scan all microarrays with the optimized settings and remember to turn the autogain off.
NOTE: For data analysis, all microarrays should be scanned using the same scanning settings. For kinase assays using cy3 as a fluorophore, the images are scanned with a 20% PMT, laser intensity of 25%, and 10 microns of resolution, using the scanner listed in the Table of Equipment and Materials.
12. Data processing and analysis
NOTE: Several software packages are available for the quantification of microarray data with similar capabilities. The procedure described here was designed for the software listed in the Table of Equipment and Materials.
- Load the TIFF files to be quantified, design the grid to match the microarray layout and adjust the size of the spots to incorporate the entire signal with the minimum area possible. Neighboring spots should not overlap. Visually inspect how well the software is performing and adjust the grid manually, if necessary.
- Quantify the signal intensity of the microarray. Visually inspect the spots for any abnormality (non-specific binding, dust, etc.) and remove them from the data analysis.
- Correct the background locally using the signal of neighboring areas on the array in which no spot is present.
- Normalize data. To compare the signal across different arrays, the signal intensity of each microarray must be normalized. To exclude any outliers, normalize the data using the trimmed mean 30% of the signal from the positive control (IgG spots) of the dephosphorylated microarrays.
NOTE: The signal from the IgG spot does not change during the phosphorylation and dephosphorylation of the microarrays and is suitable for the normalization. - Identify active kinases. For each feature displayed on the microarray, calculate the ratio between the normalized signal intensity in the autophosphorylated and dephosphorylated arrays. Set a threshold of 1.5-fold change for the identification of the active kinases and mark all the other features as unable to undergo autophosphorylation (N/A).
- Calculate the activity of each kinase identified in step 12.5 as a percentage of adjusted signal (signal intensity of the normalized positive control array (DMSO) subtracted by the signal intensity of the normalized negative control array (dephosphorylated).
Results
Self-assembled NAPPA microarrays provide a solid platform that can been used for many distinct applications, including biomarker discovery, protein-protein interactions, substrate identification, and drug screening10,11,12,13,14,15,16,17,18,19,20.
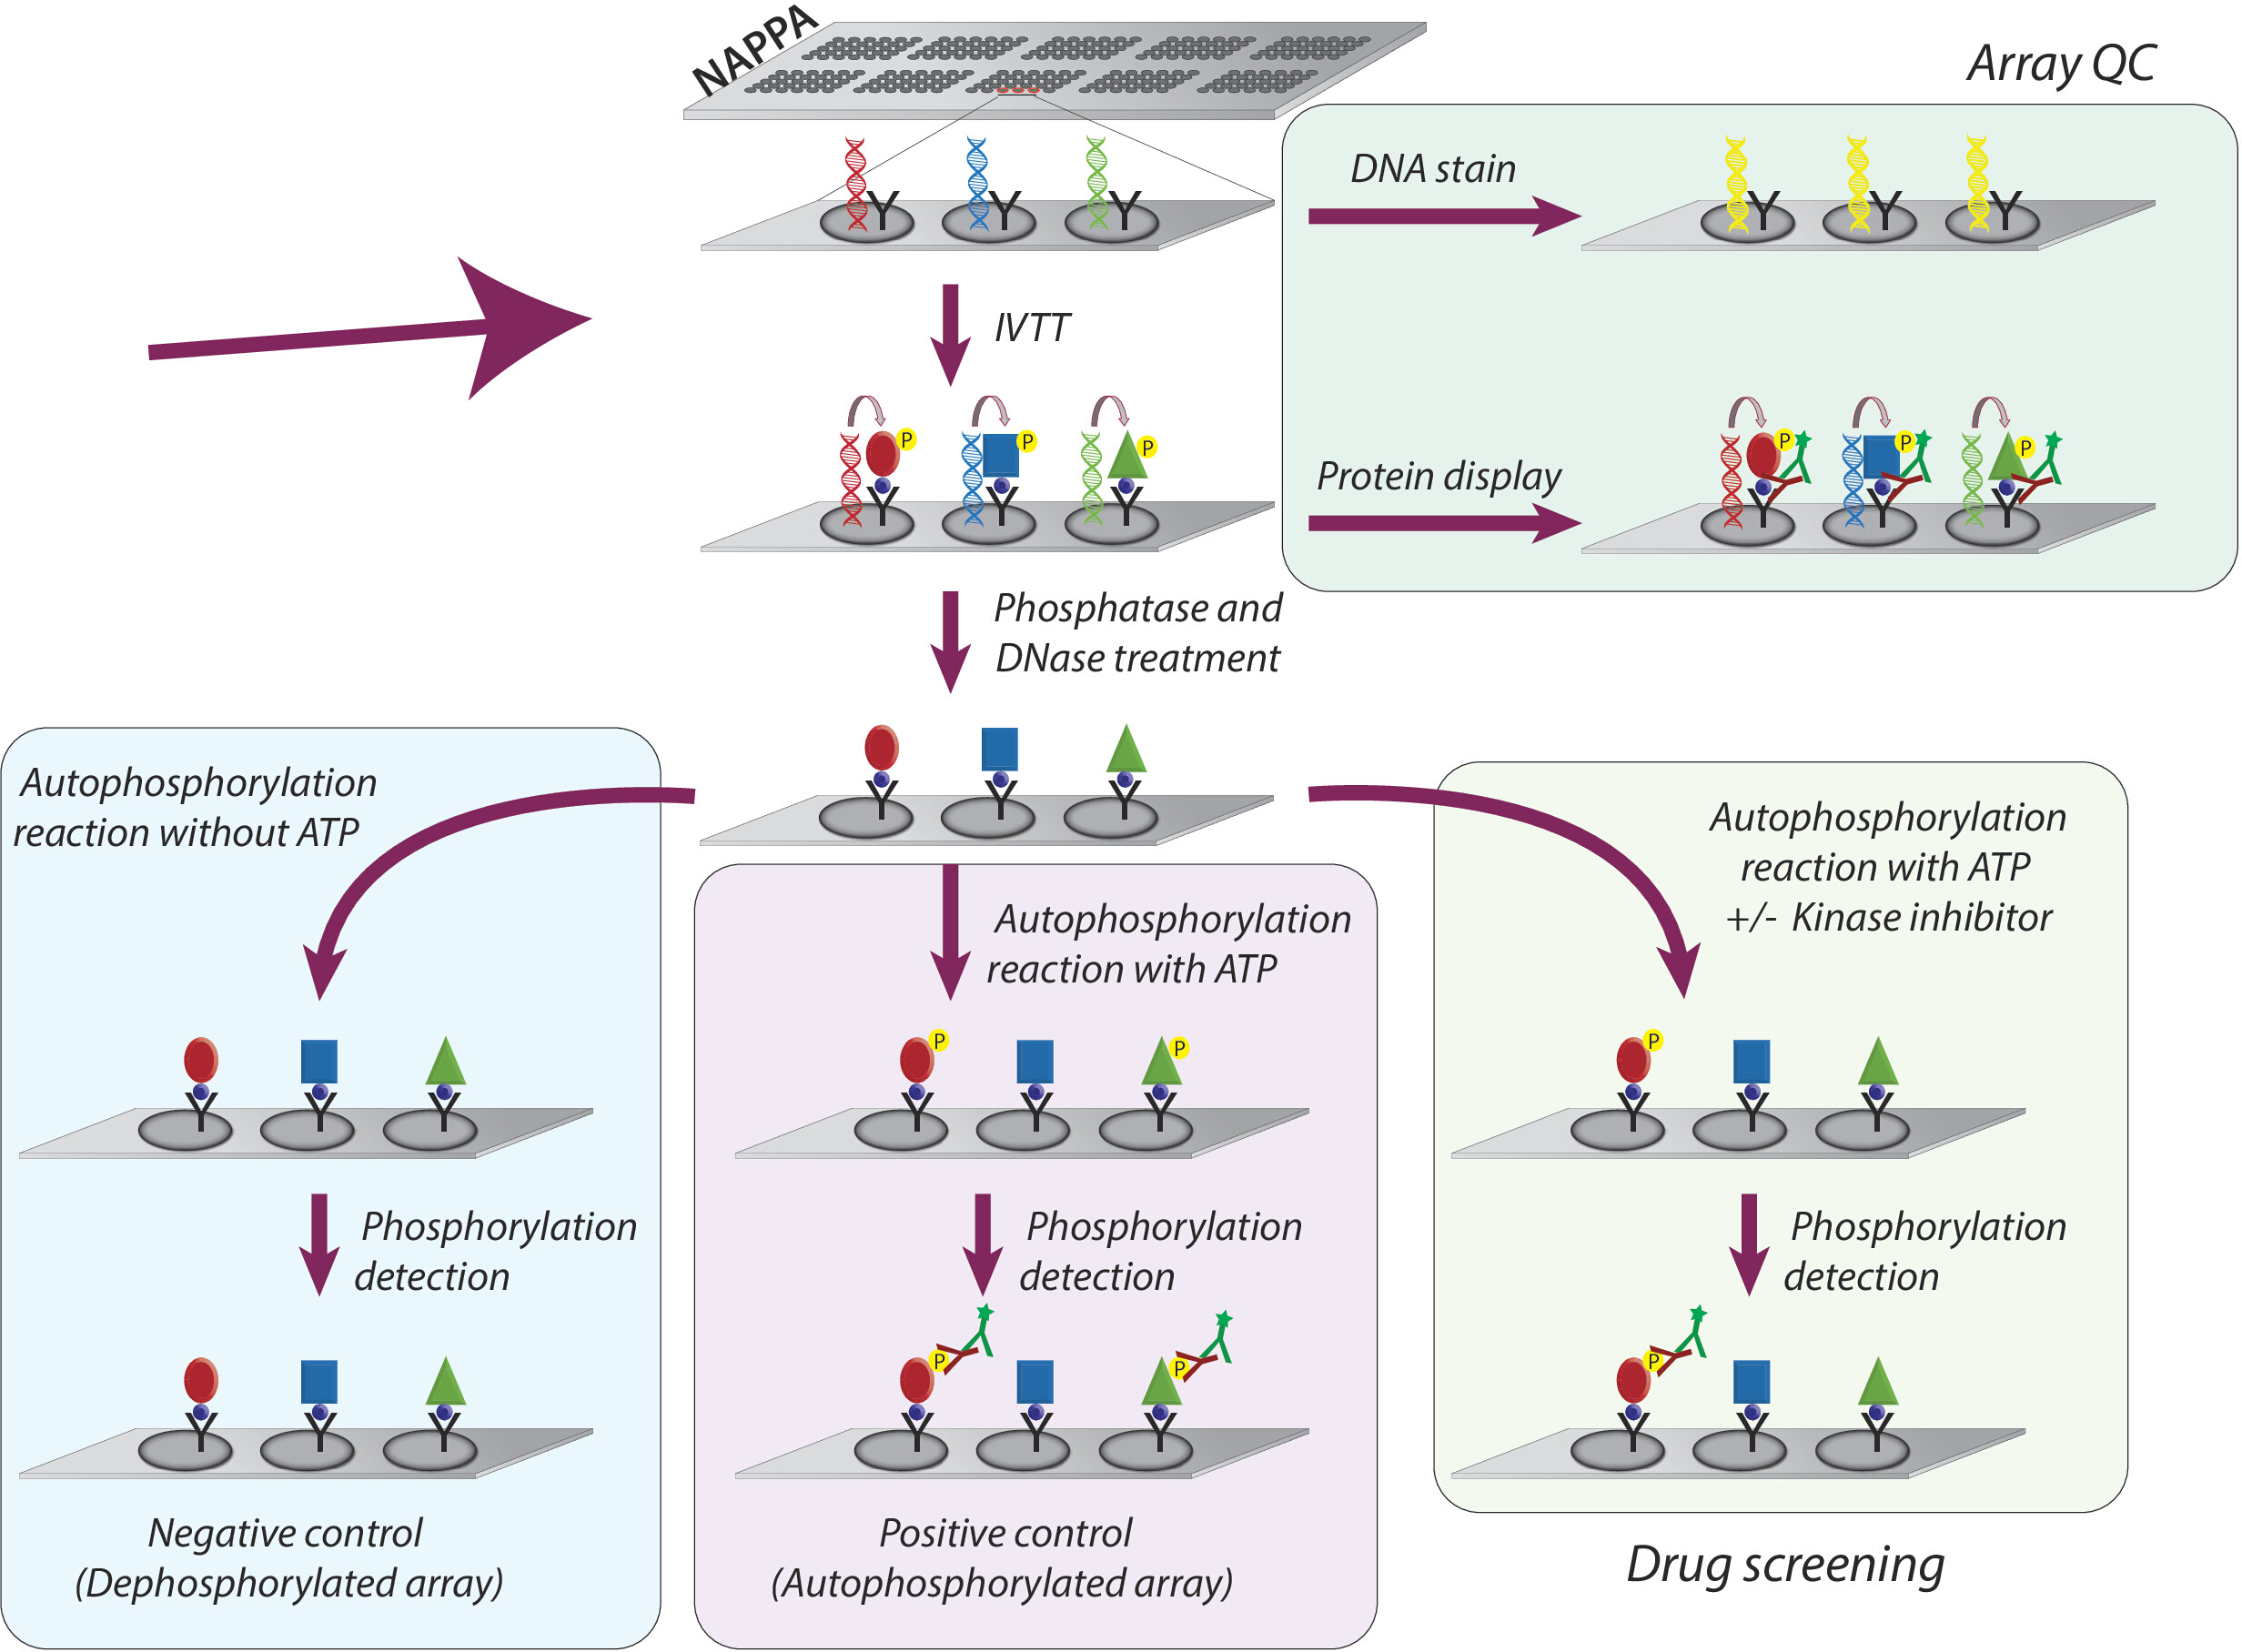
The overall methodology adopted for the study of kinase activity and screening of tyrosine kinases inhibitors on NAPPA microarrays is schematically represented in Figure 1. First, NAPPA microarrays are generated by the immobilization of cDNA and capture agent onto the coated microarrays. The cDNAs are then used as a template for the transcription and translation of proteins, using a human-based IVTT system, and the newly synthesized proteins are immobilized by the capture agent9. The quality of the printed microarray can be monitored by measuring levels of DNA (confirming consistent printing) or protein displayed on the array (confirming protein expression and capture; Figure 1). To decrease the background signal and increase the dynamic range of the experiment, the microarrays are treated with 1) lambda phosphatase to remove phosphorylation from Ser/Thr/Tyr residues, then with 2) DNase to simplify the chemistry on the spot and decrease background (Figure 1).
The next step is the autophosphorylation reaction, in which microarrays are incubated with kinase buffer in the absence of ATP (negative control array, referred to as dephosphorylated microarrays), and kinase buffer is supplemented with ATP (positive control, referred to as autophosphorylated arrays) or ATP + DMSO (vehicle control). It should be emphasized that during this step, no kinase is added; therefore, the intrinsic activity of each kinase displayed on the microarray is quantified through measurement of its phosphorylation levels using a pan anti-phospho-tyrosine antibody followed by a cy3-labbeled secondary antibody (Figure 1).
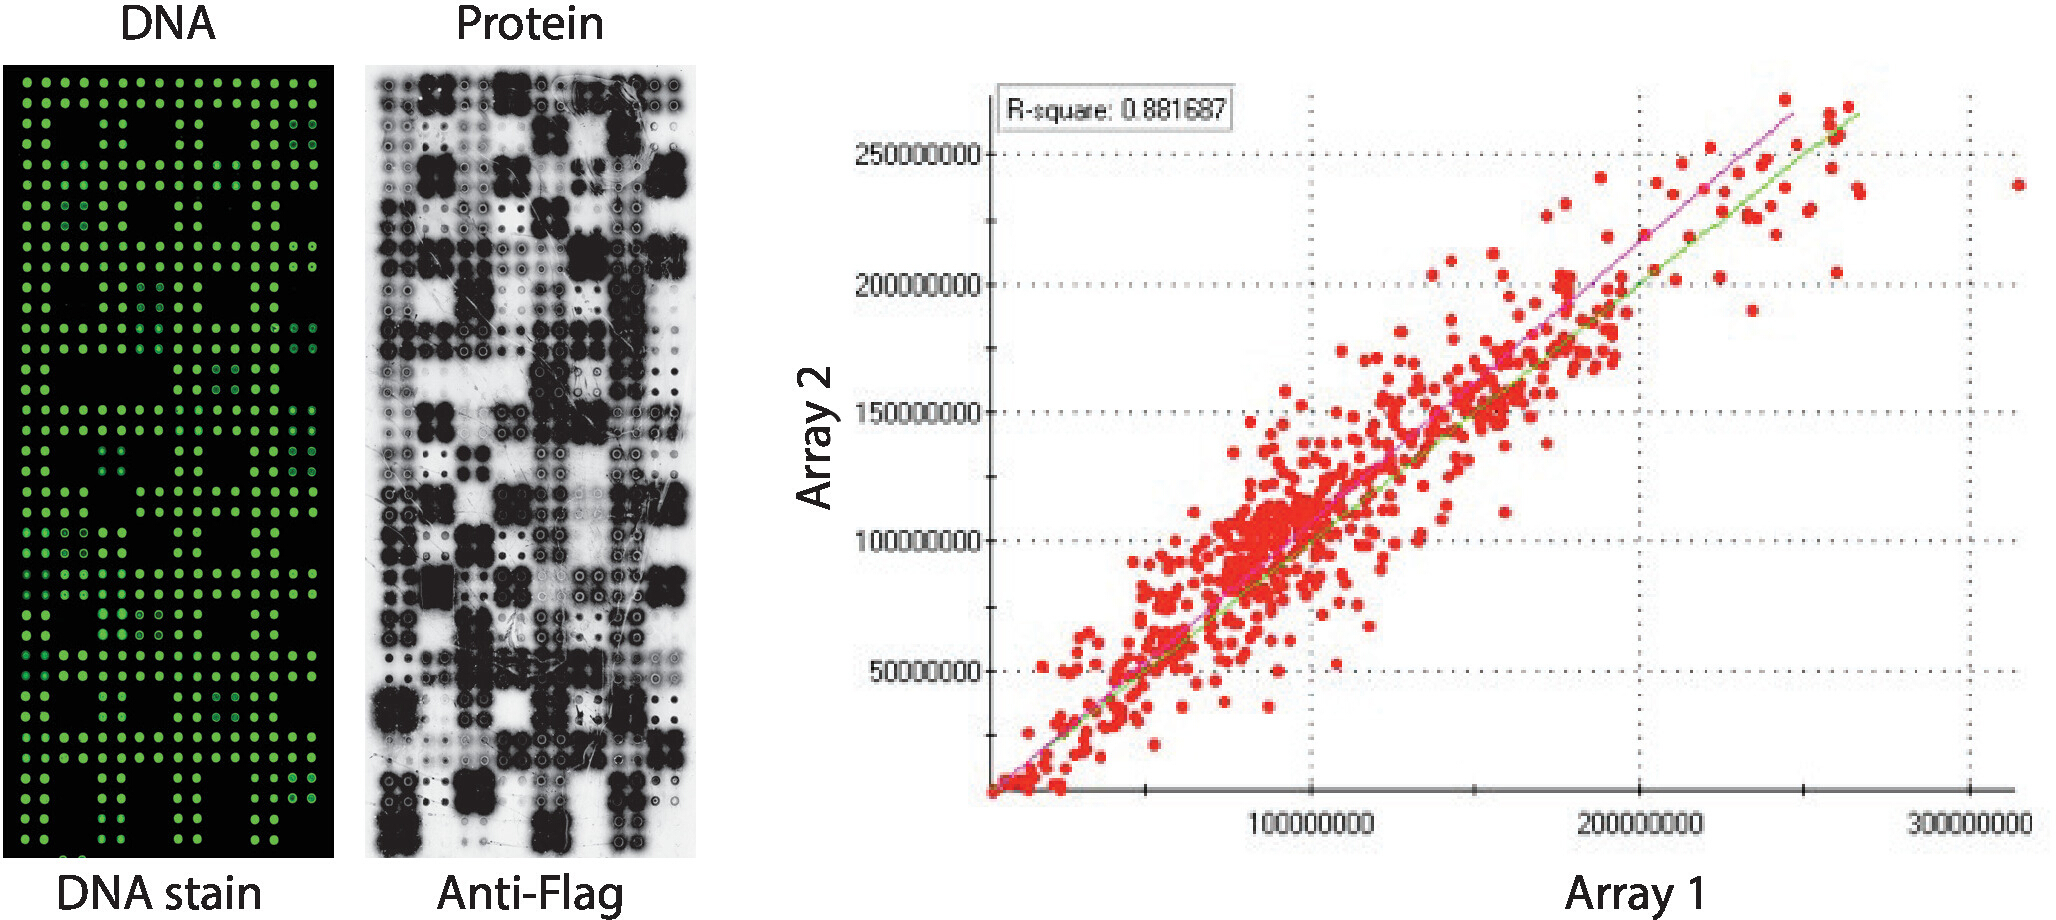
Quality control of the NAPPA-kinase arrays displaying a panel of human protein kinases printed in quadruplicate is shown in Figure 2. The levels of immobilized DNA were measured by DNA staining and it showed an even signal across the microarray, suggesting the amount of DNA printed on the array was uniform. It is also possible to observe several features without any DNA staining. These features correspond to some controls in which DNA was omitted from the printing mix [i.e., empty spots (nothing was printed), water spots, purified IgG spot (poly-lysine, crosslinker and purified IgG), printing mix only (complete printing mix: poly-lysine plus crosslinker and anti-flag antibody, without any DNA)]. The levels of protein displayed on the NAPPA-kinase microarrays were assessed after the IVTT reaction using anti-tag antibody.
For the kinase screening, Flag was used as the tag of choice and the level of protein displayed on the microarray was measured using an anti-flag antibody. As shown, the majority of spots containing cDNA successfully displayed detectable levels of protein. Some of the control spots without cDNA also revealed signal with the anti-flag antibody: IgG spot (used to detect the activity of the secondary antibody) and empty vector spots (cDNA codes for the tag only) (Figure 2). NAPPA-kinase microarrays showed good reproducibility among slides, with the correlation of the levels of protein display among distinct printing batches higher than 0.88 (Figure 2). Within the same batch the correlation was even higher, close to 0.92 (data not shown).
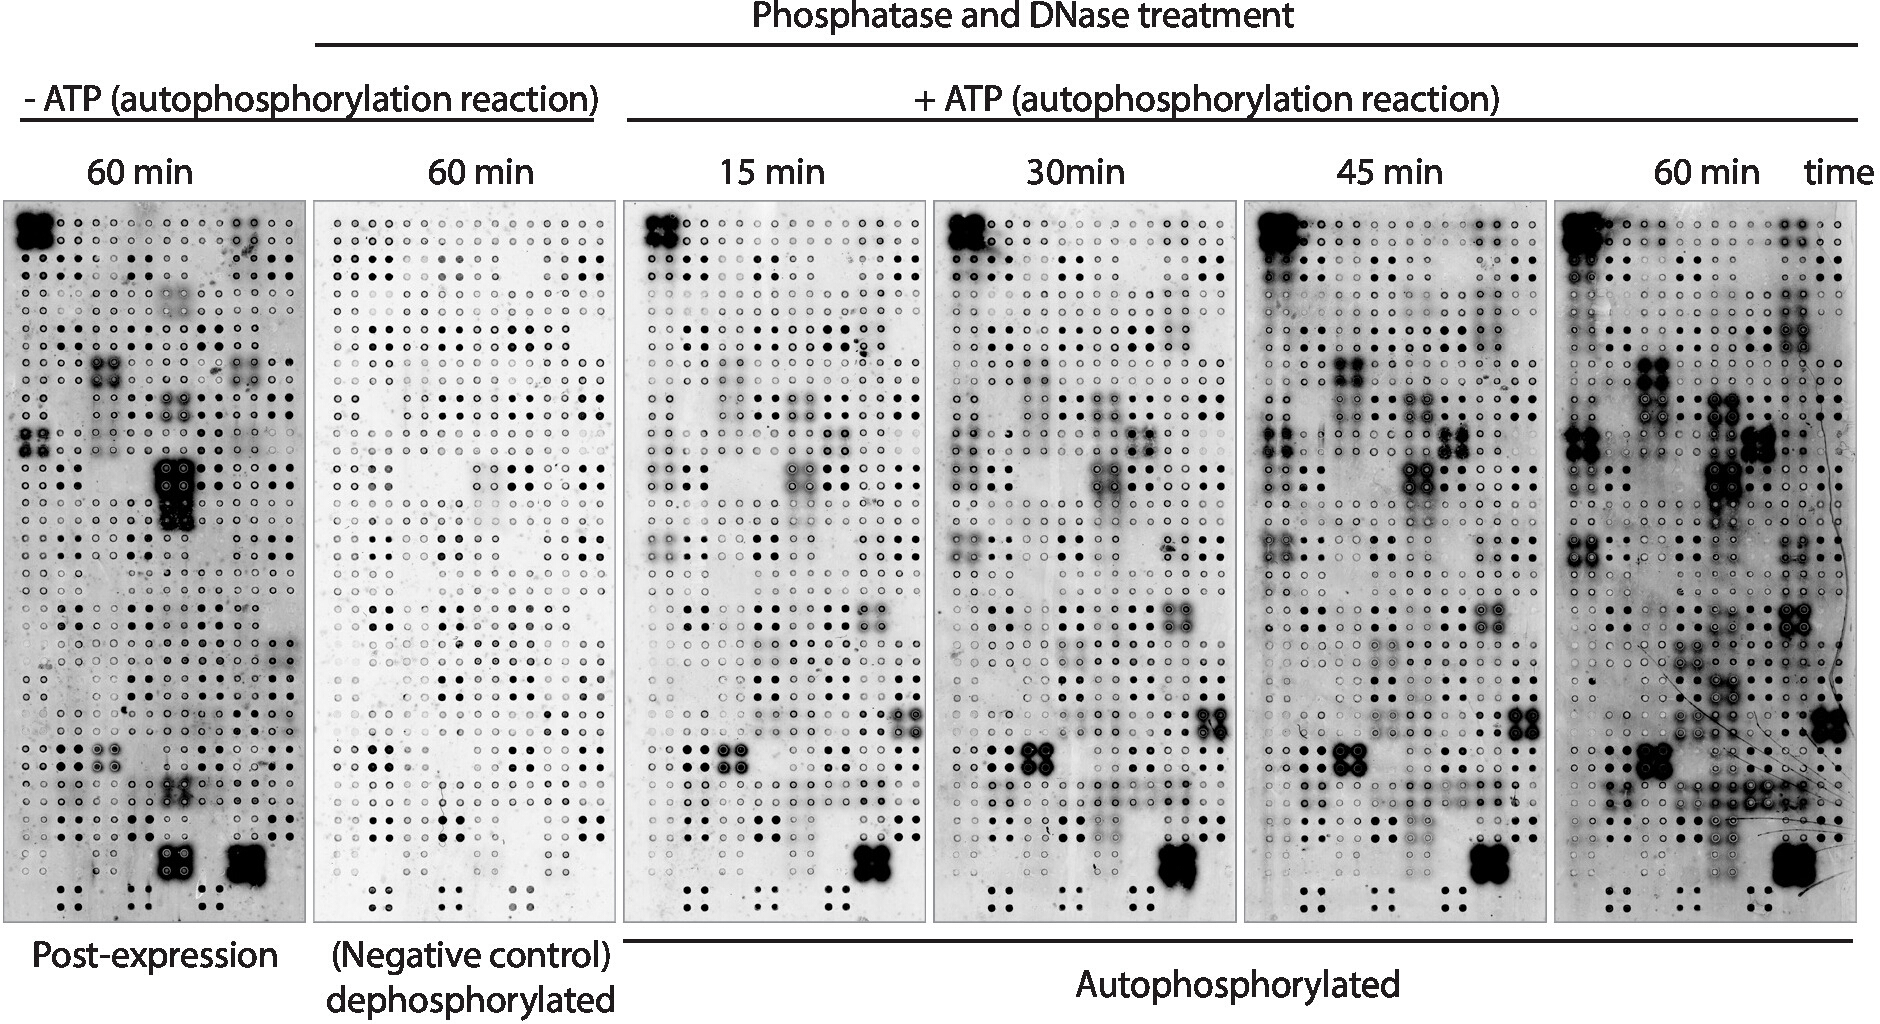
Next, the kinase autophosphorylation activity of the proteins displayed on the array was measured using anti-phospho-tyrosine antibody (Figure 3). Protein displayed on the array showed high levels of protein phosphorylation after expression (Figure 3, left), which may be caused by intrinsic kinase activity of the protein displayed on the array or by active kinases present in the IVTT mix. This phosphorylation was completely removed with lambda phosphatase treatment and these microarrays were used for the kinase assays. After dephosphorylation, autophosphorylation reactions performed without ATP showed no significant levels of phosphorylation, as expected, while microarrays incubated with kinase buffer in the presence of ATP showed protein phosphorylation as fast as 15 min (Figure 3). For the drug screening, the kinase activity was measured after 60 min of autophosphorylation reaction to maximize the number of kinases tested.
The comparison between microarrays in which the phosphorylation levels were measured right after protein expression (Figure 3, left) and after 60 min of autophosphorylation reaction (Figure 3, right) showed: i) proteins phosphorylated only after expression, suggesting they can be exogenously phosphorylated by proteins present on the IVTT mix, but cannot be autophosphorylated; ii) protein phosphorylated only after the autophosphorylation reaction, suggesting these proteins were not active after protein expression and required co-factors present in the kinase buffer to be active; or iii) protein phosphorylated on both arrays, suggesting they were active in both settings (Figure 3).
As an example of the results obtained for the screening of tyrosine kinase inhibitors on NAPPA-kinase arrays three kinases inhibitors with distinct selectivity across protein kinases were used: staurosporine, imatinib and ibrutinib. For all screenings, dephosphorylated NAPPA microarrays were incubated with increasing concentrations of TKI (ranging from 100 nM to 10 uM) during the autophosphorylation reaction. The first TKI tested was staurosporine, a global protein kinase inhibitor, that showed potent kinase inhibition on the microarray across virtually all kinases tested11.
Next, imatinib was tested, an ABL and c-Kit inhibitor used for the treatment of chronic myelogenous leukemia and gastrointestinal stromal tumors4,5,6,7. On NAPPA-kinase arrays imatinib showed a significant reduction in Abl1 and BCR-Abl1 activity whereas other kinases remained mostly unaffected (Figure 4A). The data quantification for the kinase activity was normalized against the dephosphorylated array and represented as a percentage of the positive control microarray (vehicle only). Data for TNK2 (non-relevant kinase), Abl1 and BCR-Abl1 is shown in Figure 4B. As expected, imatinib showed selective inhibition towards Abl1 and BCR-ABl1. The data for c-Kit was inconclusive due to lack of activity on the positive control arrays.
Finally, ibrutinib, an FDA-approved covalent inhibitor of Bruton’s tyrosine kinase (BTK), was tested. Ibrutinib is currently used in the treatment of several blood-related cancers with overactive BTK, including chronic lymphocytic leukemia (CLL), mantle cell lymphoma, and Waldenström’s macroglobulinemia21,22. Figure 4C, is representative of typical results obtained for the ibrutinib screening. The kinase activity of ABL1 (non-relevant kinase) and BTK (canonical target) and ERBB4 (potential new target) is shown in Figure 4D. The data suggests ERBB4 can be inhibited by ibrutinib in a dose specific fashion. This inhibition was confirmed in vitro and in cell-based assays11, demonstrating the power of this platform.
Taken together, the data suggest that NAPPA-kinase microarray platform could be used for the unbiased screening of TK inhibitors. Moreover, the screening is fast and can be easily customized to include any variation of the protein kinases of interest.

Figure 1: Schematic representation of quality control and screening of tyrosine kinase inhibitors in NAPPA arrays. NAPPA arrays are printed with cDNA coding for the protein of interest fused with a tag and a capture antibody. During the in vitro transcription and translation reaction (IVTT) the synthesized proteins are captured on the microarray surface through the tag by the capture antibody. The quality control (QC) of the arrays is performed by the measurement of the levels of DNA printed on the slide, using a fluorescent DNA-intercalating dye, and the levels of protein displayed on the array using tag-specific antibodies. For the kinase screening, the microarrays are treated with DNase and phosphatase, after the IVTT reaction, to remove the printed DNA and all phosphorylation that may have occurred during protein synthesis. The dephosphorylated arrays are now ready to be used for the drug screen. For each assay, three sets of controls are routinely used: (I) dephosphorylated arrays, in which the autophosphorylation reaction is performed without ATP; (II) autophosphorylated microarrays, in which the autophosphorylation reaction is performed in the presence of ATP; and (III) DMSO treated array (vehicle), in which the autophosphorylation reaction is performed with ATP and DMSO. The slides treated with different concentration of kinase inhibitors follow the exact same protocol used for the DMSO treated arrays. Please click here to view a larger version of this figure.

Figure 2: Representative results of quality control for self-assembled NAPPA-kinase arrays. DNA content measured by a fluorescent DNA-intercalating dye (left) and levels of protein displayed on the microarray measured by anti-Flag antibody (middle) are shown. On the right side is a correlation plot of the levels of protein displayed on two NAPPA-kinase arrays printed in separate batches. Please click here to view a larger version of this figure.

Figure 3: Representative results of kinase activity in NAPPA-kinase arrays. Microarrays displaying protein kinases in quadruplicate were used to study protein kinase activity on the array through the measurement of protein phosphorylation using anti-pTyr antibody, followed by cy3-labeled anti-mouse antibody. Control arrays without phosphatase/DNase treatment and without ATP during the autophosphorylation reaction were used to measure the background phosphorylation after protein expression (post-expression). The remaining microarrays were treated with phosphatase/DNA, and the autophosphorylation reaction was performed without ATP (dephosphorylated microarray, negative control) or with ATP (autophosphorylated microarrays). For the autophosphorylated microarrays the autophosphorylation reaction was performed for 15 min, 30 min, 45 min, or 60 min, as shown. Please click here to view a larger version of this figure.

Figure 4: Representative data from tyrosine kinase screen on NAPPA-kinase arrays. (A) Phosphatase/DNase treated NAPPA-kinase arrays were incubated in increasing concentrations of imatinib during the autophosphorylation reaction and the kinase activity was measure with anti-phospho-tyr antibody. (B) Quantification of kinase activity observed on NAPPA-kinase arrays exposed to imatinib. Data was normalized against the signal of the negative control arrays (dephosphorylated) and it is shown as a percentage of the positive control arrays (autophosporylation reaction performed in the presence of DMSO). Similar data is shown for the screening of ibrutinib (C,D). This figure has been modified from Rauf et al.11. Please click here to view a larger version of this figure.
Supplementary File 1. Alternative protocol for screening of tyrosine kinase inhibitors in NAPPA arrays using an automated hybridization station. Please click here to download this file.
Discussion
Modifications and troubleshooting
During the optimization phase of the study of kinase activity on NAPPA arrays, one of the main sources of background and low dynamic range observed was the BSA used on the printing mix. BSA was providing the primary amines necessary for crosslinking with the aminosilane surface and was trapping the DNA and the capture antibody on the spot. However, BSA is highly phosphorylated, making it difficult for the detection of the autophosphorylation signal on the array above the background noise. To solve this problem, several alternatives for BSA in the printing mix were tested, and poly-lysine was identified as good substitute. Poly-lysine lacks any phosphorylation site; therefore, the background from non-expressed arrays is very minimal. Moreover, microarrays printed with poly-lysine are reproducible and display good levels of proteins (Figure 2).
The next critical modification performed on the standard NAPPA assay was the addition of a Phosphatase/DNase treatment step. The treatment of the microarrays with phosphatase allows the removal of any phosphorylation that occurred in the IVTT mix during protein synthesis and capture (Figure 3). The source of this phosphorylation could be from intrinsic autophosphorylation activity or from the activity of kinases present in the IVTT mix. The removal of all phosphorylation post-expression allowed easy identification of the kinases that are active and can undergo autophosphorylation (Figure 3).
Critical steps within the protocol
NAPPA is a robust technology, but as expected, there are several critical steps. The first is the acquisition of high quality DNA in the appropriate concentration. Using DNA of poor quality or in low concentrations will generate poor quality microarrays with several features not being expressed and displayed in the appropriate levels, decreasing the number of proteins analyzed on the array. The second critical step is the expression of proteins on the microarray. The use of an IVTT system that will express high levels of functional protein is vital for studying kinase activity on the array.
The next critical step on the TKI screening is how the microarrays are handled. The microarrays should not dry during any step of the protocol, and gentle handling is recommended to prevent scratches that can increase the background signal. Since the arrays from the entire experiment will be compared against each other, it is important to assure that every incubation step is even across all slides. For example, the time required to perform one step in a single array should be taken into consideration when a batch of 20 arrays is processed to prevent differences in the length of incubation across arrays.
Finally, design of the experiment and the inclusion of both positive and negative controls are critical for quality control and data analysis. The first set of controls are those printed in each array and includes negative controls [i.e., empty spots (without any material printed), water or empty vector (express only the tag)], as well as a positive control (i.e., purified IgG, that is detected by the secondary antibody and is inert to alteration in the phosphorylation levels). Collectively, they measure the background levels of the microarray, possible carryover during printing and the signal intensity of the detection method.
The next set of controls are the drug screening controls and include the dephosphorylated and autophosphorylated microarrays (in the presence or absence of DMSO). As mentioned earlier, the dephosphorylated microarray measures the level of phosphorylation after phosphatase treatment and therefore the baseline level for all other experiments. The lower the baseline level is, the higher the dynamic range of the assays. The autophosphorylated arrays present the maximum phosphorylation levels of all arrays and the signal should be strong and clear. It is used for data analysis, but also as a control that all reactions were performed successfully on the array.
Limitations of the technique
As of now, one of the limitations of the drug screening presented here is its ability to screen only protein kinases that can be autophosphorylated. One possible way to overcome this is to print a kinase and known substrate in the same spot. Co-printing of DNA for two distinct proteins was successfully accomplished15, suggesting the feasibility of this approach. Moreover, the protein displayed on the array might not be folded correctly resulting in an inactive protein. The use of human-based expression system made a significant improvement in the kinase activity measured on the array; however, some proteins still cannot be analyzed on the array due to its inactivity.
A second limitation is the measurement of the phosphorylation using a pan anti-phospho-tyr antibody. Despite its non-specificity regarding the motif of the phosphorylation site, all measured phosphorylations occurred on tyrosine residues, leaving behind serines and threonines and their respective kinases. To date, more than 10 pan phospho-Ser/Thr antibodies have been tested without success, despite several attempts to optimize incubation and washing conditions. A new detection system that is independent of antibodies may be the best option to expand the number of protein kinases that can be screened for drug inhibition. In this context, a few options are available including radioactivity or chemical approaches like click conjugation. A series of optimizations are required to minimize the background signal and provide a good dynamic range for the assays.
The third limitation is the acquisition of cDNA clones to be printed on the array. The cDNA clones can be generated using any cloning technique including site-specific recombination systems, such as Creator or Gateway23. Another option is to purchase the clones from the DNAsu library, found at <https://dnasu.org/DNASU/Home.do>, where more than 17,000 cDNAs clones, including the entire human kinome, is readily available to be used for the construction of NAPPA arrays24.
The fourth limitation is that not every laboratory is equipped with appropriate equipment to fabricate and screen their own NAPPA arrays. This protocol provides alternative methods to generate the DNA to be printed on the microarray, without the need of high-throughput equipment, and protocols to manually perform all the hybridization steps. However, access to an arrayer and microarray scanner is still necessary. One option to overcome this issue is to use the NAPPA core service and facility, found at <http://nappaproteinarray.org/>, which distributes customized NAPPA microarrays at a non-profit academic price. Finally, as of any screening methodology, the data obtained on the arrays are susceptible to be artefacts (either positive or negative) and therefore should be validated using orthogonal assays.
Significance with respect to existing methods
Several platforms are available commercially for the screening of protein kinases. One approach routinely used is binding assays, which can be performed with protein fragments, kinase domain, larger protein fragments with the kinase domain and some regulatory regions, and even full-length proteins. The proteins are usually expressed in bacterial systems due to the cost and simplicity in the expression and purification protocols. The interaction between the drug of interest and the protein is then measured with some type of report assay like fluorescence or presence of tags, for example. The main limitation of this set of approaches is the fact that the protein is not necessarily active during the interaction with the drug, which may result in the identification of false positive and false negative interactions. Protein fragments are particularly vulnerable to changes in the conformation and lack of activity and all the data obtained should be validated using active proteins, preferably in their full-length form. Another limitation of some of the platforms is the capability to screen only ATP analogs, limiting its overall use.
Most of the commercially available services for the screening of TKIs using enzymatic based approaches utilize only wild type versions of the kinase of interest, and sometimes only a selected few mutants. Knowing that drug resistance is very common in patients treated with TKI, it is important to be able to measure drug response in different mutants, for the selection of the most appropriate inhibitor. Due to NAPPA’s nature, the screening of kinase mutants is simple and can be easily accomplished, and the only required tool is the incorporation of the kinase mutant into the NAPPA cDNA collection, which can be done by site-specific mutagenesis, for instance.
Future applications
One of the most common forms of treatment elapse in cancer therapy using kinase inhibitors is the acquisition of mutations in the drug target during a treatment course. The screening of these mutants regarding their response to kinase inhibitors is of vital importance for the selection of second/third generation of TKIs to achieve a personalized treatment for each patient. The drug screening approach presented here, provides an unbiased screening platform in which any tyrosine kinase inhibitor can be tested against a panel of tyrosine kinases present in the human genome. Since the proteins displayed on NAPPA arrays are expressed in vitro from the cDNA printed on the slide, any mutant variant can easily be incorporated in the cDNA collection to be displayed on the array. The facility in which the kinase mutants can be generated and expressed on the array, combined with the high-throughput power of the NAPPA technique, provides a unique environment for the study of kinase mutants and their response to drugs, making NAPPA suitable for personalized drug screening, one of the goals of precision medicine.
Disclosures
The authors declare no conflicts of interest.
Acknowledgements
The authors would like to thank everyone at the LaBaer’s lab for their help and criticism during the development of the project. This project was supported by the NIH grant U01CA117374, U01AI077883 and Virginia G. Piper Foundation.
Materials
| Name | Company | Catalog Number | Comments |
| Reagent/Material | |||
| 364 well plates (for arraying) | Genetix | x7020 | |
| 800 µL 96-well collection plate | Abgene | AB-0859 | |
| 96-pin device | Boekel | 140500 | |
| Acetic Acid | Millipore-Sigma | 1.00066 | |
| Acetone 99.9% | Millipore Sigma | 650501 | |
| Aluminum seal for 96 well plates | VWR | 76004-236 | |
| Aminosilane (3-aminopropyltriethoxysilane) | Pierce | 80370 | |
| ANTI-FLAG M2 antibody produced in mouse | Millipore Sigma | F3165 | |
| Anti-Flag rabbit Antibody (polyclonal) | Millipore Sigma | F7425 | |
| ATP 10 mM | Cell Signaling | 9804S | |
| β-Glycerophosphate disodium salt hydrate | Millipore-Sigma | G9422 | |
| bacteriological agar | VWR | 97064-336 | |
| Blocking Buffer | ThermoFisher/Pierce | 37535 | |
| Brij 35 | ThermoFisher/Pierce | BP345-500 | |
| BS3 (bis-sulfosuccinimidyl) | ThermoFisher/Pierce | 21580 | |
| BSA (bovine serum albumin) | Millipore Sigma | A2153 | |
| Coverslip 24 x 60 mm | VWR | 48393-106 | |
| Cy3 AffiniPure Donkey Anti-Mouse IgG (H+L) | Jackson ImmunoResearch | 715-165-150 | |
| DeepWell Block, case of 50 | ThermoFisher/AbGene | AB-0661 | |
| DEPC water | Ambion | 9906 | |
| DMSO (Dimethyl Sulfoxide) | Millipore-Sigma | D8418 | |
| DNA-intercalating dye | Invitrogen | P11495 | |
| DNase I | Millipore-Sigma | AMPD1-1KT | |
| DTT | Millipore-Sigma | 43816 | |
| EDTA | Millipore-Sigma | EDS | |
| Ethanol 200 proof | Millipore-Sigma | E7023 | |
| Filter plates | Millipore-Sigma | WHA77002804 | |
| Gas Permeable Seals, box of 50 | ThermoFisher/AbGene | AB-0718 | |
| Glass box | Wheaton | 900201 | |
| Glass slides | VWR | 48300-047 | |
| Glycerol | Millipore-Sigma | G5516 | |
| HCl (Hydrochloric acid) | Millipore-Sigma | H1758 | |
| HEPES Buffer Solution | Millipore-Sigma | 83264 | |
| Human-based IVTT system | Thermo Scientific | 88882 | |
| ImmunoPure Mouse IgG whole molecule | ThermoFisher/Pierce | 31202 | |
| Isopropanol | Millipore-Sigma | I9516 | |
| KCl (Potassium chloride) | Millipore-Sigma | P9333 | |
| KH2PO4(Potassium phosphate monobasic) | Millipore-Sigma | P5655 | |
| Kinase buffer | Cell Signaling | 9802 | |
| KOAc (Potassium acetate) | Millipore-Sigma | P1190 | |
| Lambda Protein Phosphatase | new england biolabs | P0753 | |
| Lifterslips, 24 x 60 mm | ThermoFisher Scientific | 25X60I24789001LS | |
| Metal 30-slide rack with no handles | Wheaton | 900234 | |
| MgCL2 (Magnesium chloride) | Millipore-Sigma | M8266 | |
| Na3VO4 (Sodium orthovanadate) | Millipore-Sigma | S6508 | |
| NaCl (Sodium Chloride) | Millipore-Sigma | S3014 | |
| NaOAc (Sodium acetate) | Millipore-Sigma | S2889 | |
| NaOH (Sodium hydroxide) | Millipore-Sigma | S8045 | |
| NucleoBond Xtra Midi / Maxi | Macherey-Nagel | 740410.10 / 740414.10 | |
| Nucleoprep Anion II | Macherey Nagel | 740503.1 | |
| Phosphoric Acid | Millipore-Sigma | 79617 | |
| Poly-L-Lysine Solution (0.01%) | Millipore-Sigma | A-005-C | |
| Protein Phosphatase (Lambda) | New England Biolabs | P0753 | |
| RNAse | Invitrogen | 12091021 | |
| SDS (Sodium dodecyl sulfate) | Millipore-Sigma | L6026 | |
| SDS (Sodium dodecyl sulfate) | Millipore-Sigma | 05030 | |
| Sealing gasket | Grace Bio-Labs, Inc | 44904 | |
| Silica packets | VWR | 100489-246 | |
| Single well plate | ThermoFisher/Nalge Nunc | 242811 | |
| Sodium acetate (3M, pH 5.5) | Millipore-Sigma | 71196 | |
| TB media (Terrific Broth) | Millipore-Sigma | T0918 | |
| Tris | IBI scientific | IB70144 | |
| Triton X-100 | Millipore-Sigma | T8787 | |
| Tryptone | Millipore-Sigma | T7293 | |
| Tween 20 | Millipore-Sigma | P9416 | |
| Yeast Extract | Millipore-Sigma | Y1625 | |
| Name | Company | Catalog number | Comments |
| Equipments | Maker/model | ||
| Programmable chilling incubator | Torrey Pines IN30 Incubator with Cooling | ||
| Shaker for bacterial growth | ATR Multitron shaker | ||
| Vacuum manifold with liquid waste trap | MultiScreenVacuum Manifold 96 well | ||
| 96 well autopippetor/liquid handler | Genmate or Biomek FX | ||
| Liquid dispenser | Wellmate | ||
| DNA microarrayer | Genetix QArray2 | ||
| Automatic hybridization station | Tecan HS4800 Pro Hybridization Station | ||
| Microarray scanner | Tecan PowerScanner | ||
| Microarray data quantification | Tecan Array-ProAnalyzer 6.3 |
References
- Melnikova, I., Golden, J. Targeting protein kinases. Nature Review Drug Discovery. 3 (12), 993-994 (2004).
- Patterson, H., Nibbs, R., McInnes, I., Siebert, S. Protein kinase inhibitors in the treatment of inflammatory and autoimmune diseases. Clinical and Experimental Immunology. 176 (1), 1-10 (2014).
- Wu, P., Nielsen, T. E., Clausen, M. H. FDA-approved small-molecule kinase inhibitors. Trends Pharmacological Sciencies. 36 (7), 422-439 (2015).
- Druker, B. J., et al. Effects of a selective inhibitor of the Abl tyrosine kinase on the growth of Bcr-Abl positive cells. Nature Medicine. 2 (5), 561-566 (1996).
- Heinrich, M. C., et al. Inhibition of c-kit receptor tyrosine kinase activity by STI 571, a selective tyrosine kinase inhibitor. Blood. 96 (3), 925-932 (2000).
- Stagno, F., et al. Imatinib mesylate in chronic myeloid leukemia: frontline treatment and long-term outcomes. Expert Review Anticancer Therapy. 16 (3), 273-278 (2016).
- Ben Ami, E., Demetri, G. D. A safety evaluation of imatinib mesylate in the treatment of gastrointestinal stromal tumor. Expert Opinions in Drug Safety. 15 (4), 571-578 (2016).
- Ramachandran, N., et al. Self-assembling protein microarrays. Science. 305 (5680), 86-90 (2004).
- Festa, F., et al. Robust microarray production of freshly expressed proteins in a human milieu. Proteomics Clinical Applications. 7 (5-6), 372-377 (2013).
- Yazaki, J., et al. Mapping transcription factor interactome networks using HaloTag protein arrays. Proceedings of the National Academy of Sciences of the United States of America. 113 (29), E4238-E4247 (2016).
- Rauf, F., et al. Ibrutinib inhibition of ERBB4 reduces cell growth in a WNT5A-dependent manner. Oncogene. 37 (17), 2237-2250 (2018).
- Anderson, K. S., et al. Protein microarray signature of autoantibody biomarkers for the early detection of breast cancer. Journal of Proteome Research. 10 (1), 85-96 (2011).
- Wang, J., et al. Plasma Autoantibodies Associated with Basal-like Breast Cancers. Cancer Epidemiol Biomarkers Prevention. 24 (9), 1332-1340 (2015).
- Bian, X., et al. Tracking the Antibody Immunome in Type 1 Diabetes Using Protein Arrays. Journal of Proteome Research. 16 (1), 195-203 (2017).
- Song, L., et al. Identification of Antibody Targets for Tuberculosis Serology using High-Density Nucleic Acid Programmable Protein Arrays. Molecular and Cellular Proteomics. 16 (4 suppl 1), S277-S289 (2017).
- Wang, J., et al. Comparative Study of Autoantibody Responses between Lung Adenocarcinoma and Benign Pulmonary Nodules. Journal of Thoracic Oncology. 11 (3), 334-345 (2016).
- Montor, W. R., et al. Genome-wide study of Pseudomonas aeruginosa outer membrane protein immunogenicity using self-assembling protein microarrays. Infection and Immunity. 77 (11), 4877-4886 (2009).
- Tang, Y., Qiu, J., Machner, M., LaBaer, J. Discovering Protein-Protein Interactions Using Nucleic Acid Programmable Protein Arrays. Current Protocols in Cell Biology. 74, 11-15 (2017).
- Yu, X., et al. Copper-catalyzed azide-alkyne cycloaddition (click chemistry)-based detection of global pathogen-host AMPylation on self-assembled human protein microarrays. Molecular and Cellular Proteomics. 13 (11), 3164-3176 (2014).
- Anderson, K. S., et al. Autoantibody signature for the serologic detection of ovarian cancer. Journal of Proteome Research. 14 (1), 578-586 (2015).
- Woyach, J. A., Johnson, A. J., Byrd, J. C. The B-cell receptor signaling pathway as a therapeutic target in CLL. Blood. 120 (6), 1175-1184 (2012).
- Smith, M. R. Ibrutinib in B lymphoid malignancies. Expert Opinion on Pharmacotherapy. 16 (12), 1879-1887 (2015).
- Festa, F., Steel, J., Bian, X., Labaer, J. High-throughput cloning and expression library creation for functional proteomics. Proteomics. 13 (9), 1381-1399 (2013).
- Seiler, C. Y., et al. DNASU plasmid and PSI:Biology-Materials repositories: resources to accelerate biological research. Nucleic Acids Research. 42, D1253-D1260 (2014).
Reprints and Permissions
Request permission to reuse the text or figures of this JoVE article
Request PermissionThis article has been published
Video Coming Soon
Copyright © 2025 MyJoVE Corporation. All rights reserved